What's New Archive
The surface mooring at the Kuroshio Extension Observatory (KEO), which broke away from its anchor on May 19, was recovered on July 21 by the Japanese charter ship, Kaiyo. Despite being caught in eddies and an ocean jet, the drifting KEO buoy, its sensor suite and nearly 8 kilometers of mooring line was recovered. Due to travel restrictions associated with COVID19, there were no NOAA personnel onboard the Kaiyo for this rescue. This mission relied on a large contingent for its success, including the assistance of engineers, technicians and administrative staff at NOAA’s Pacific Marine Environmental Laboratory (PMEL), funding from NOAA Research’s Global Ocean Monitoring and Observing (GOMO), partners at the Japan Agency for Marine-Earth Science and Technology (JAMSTEC), and the Kaiyo captain and crew.
The KEO station is located off the coast of Japan. NOAA has maintained a surface mooring there since 2004, and JAMSTEC has maintained a subsurface sediment trap at KEO since 2014. The KEO surface mooring carries a suite of instrumentation to monitor air-sea exchanges of heat, moisture, momentum (wind stress), and carbon dioxide; surface ocean acidification; and upper ocean temperature, salinity and currents. This region has some of the largest air-sea heat and carbon dioxide fluxes in the world’s ocean. The KEO station is an important reference data set for assessing satellite observations, numerical weather prediction and climate models. Its data are being used worldwide to better understand weather, climate, and the carbon cycle.
Today, NOAA unveiled its new 10-year research roadmap to help the nation’s scientists, resource managers, and coastal communities address acidification of the open ocean, coasts, and Great Lakes.
The research plan sets out three major objectives for ocean, coastal, and Great Lakes acidification research, and includes regional chapters for coastal zones around the U.S., Great Lakes, territories - including Puerto Rico and American Samoa - and deep ocean regions. The three national research objectives are:
- Expand and advance observing systems and technologies to improve the understanding of and ability to predict acidification trends and processes;
- Understand the ways acidification is impacting ecologically and economically important species and the ecosystems they live in, and improve our ability to predict how these ecosystems and species may respond to acidification and other stressors; and
- Identify and engage stakeholders and partners, assess needs, and generate products and tools that support management decisions, adaptation, and resilience to acidification.
The plan highlights the importance of NOAA’s collaborations with international, interagency, and external academic and industry research partners, which have contributed vastly to our collective understanding of acidification. A team of more than 80 NOAA authors and non-NOAA technical contributors crafted the research plan, including PMEL's Simone Alin, Brendan Carter, Jessica Cross, Richard Feely, Carol Stepien and Adrienne Sutton.
PMEL's Carbon Program's mission is to advance our scientific understanding of the ocean carbon cycle by documenting the evolving state of the ocean carbon chemistry with high quality measurements on ships and autonomous platforms, studying the processes controlling the role of the ocean in the global carbon cycle, and investigating how rising atmospheric CO2 and climate change affect the chemistry of the oceans and its marine ecosystems.This research is relevant to many challenges our society is currently facing including climate change, managing our fisheries, and protecting our oceans, coasts and Great Lakes.
For additional information on NOAA’s acidification research, please refer to NOAA's Ocean, Coastal, and Great Lakes Acidification Research Plan (Full Plan or Highlights), the NOAA Ocean Acidification Program website’s plan page, and the Interagency Working Group on Ocean Acidification website.
The ocean is the flywheel that propels the climate system, storing huge amounts of heat and carbon in a vast reservoir that covers 70 percent of Earth’s surface. Measuring changes in that heat content over time has been a subject of intense scientific research, with analyses growing more precise as observing systems expand and the duration of measurements grows. In a new article published in the journal Nature Climate Change, Gregory Johnson and John Lyman with PMEL's Large Scale Ocean Physics group analyzed four prominent ocean temperature datasets and found that over the past 52 years, the number of ocean regions showing long-term warming trends dwarfs the regions showing cooling trends.
“Ocean warming is tightly linked to increases in atmospheric greenhouse gases concentrations, so global ocean temperature trends are an important yardstick for measuring climate change,” said Johnson. “We noticed that as the time-series of upper ocean heat content we were analyzing grew over the years, more of the ocean area was covered by a statistically significant warming trend.”
Johnson and Lyman decided to step back and look at how temperature trends changed when estimated over varying time periods. To investigate those questions, the pair generated annual maps of ocean heat content anomalies in the upper 700 meters of ocean from 1993 to 2019 by combining sea-level data from satellite altimeters with ocean temperature data. They also analyzed annual maps of ocean temperature data from the upper 700 meters from 1968 to 2019 from three other research groups: NOAA’s National Center for Environmental Information, the Japan Meteorological Agency, and the Chinese Academy of Science’s Institute of Atmospheric Physics.
For the 27-year period 1993 to 2019, they found 53 percent of the global ocean exhibited statistically significant warming trends versus 3 percent of the ocean showing significant cooling trends. For the 52-year period from 1968 to 2019, the imbalance grew markedly: 72 to 79 percent of the ocean area showed warming, while only 1 to 3 percent exhibited cooling. When trends were estimated over shorter 5-year periods, the areas and imbalances were much smaller, with 24% warming and 17% cooling.
While the ocean has soaked up the overwhelming majority of greenhouse warming, it hasn’t come without a cost. Warmer water occupies more space than cooler water, and about 42 percent of sea level rise documented since 1993 is due to thermal expansion caused by global warming. Rising ocean temperatures are also associated with increased marine heatwaves, which in turn can devastate coral reefs, dislocate or disrupt distributions of important fish species, and increase vertical ocean stratification, which reduces nutrients in surface water, and decreases dissolved oxygen at depth, both of which affect ecosystems, fisheries, and possibly even ocean carbon storage. Rising ocean temperatures can also influence changes in the climate and promote rapid intensification of tropical cyclones.
Read the full article on NOAA Research.
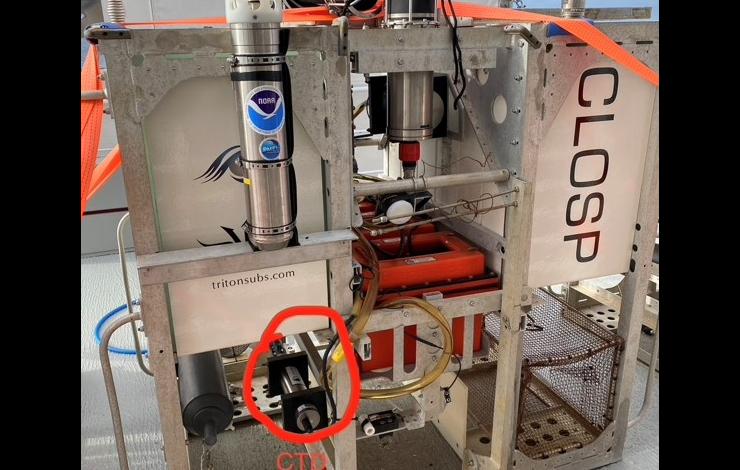
PMEL Acoustics Program and Engineering Development Division participated as part of a memorandum of understanding between NOAA and Caladan providing subject matter expertise on pressure sensors and acoustics during the June mission in the Mariana Trench to map the Challenger Deep with pressure sensors and collect oceanographic data. A full-ocean depth hydrophone was deployed during the Ring of Fire Expedition at Challenger Deep. The hydrophone was deployed on a lander with several deep-ocean pressure sensors over two cruises in the Challenger Deep basin. In addition, water samples for environmental DNA analysis have also been collected.
The first dive was completed on June 8 by Kathy Sullivan and Victor Vescovo aboard the Limiting Factor, a two-person submersible built by Triton Submarines and Caladan Oceanic. The recordings from the hydrophone are also part of acoustics research conducted by Woods Hole Oceanographic Institution to determine how sound waves propagate in the deepest parts of the ocean.
PMEL successfully first deployed the hydrophone in 2015 to establish a baseline for noise in the ocean’s deepest location. The recordings captured a baleen whale’s call, a magnitude 5.0 earthquake, an overhead typhoon and ship traffic noise.
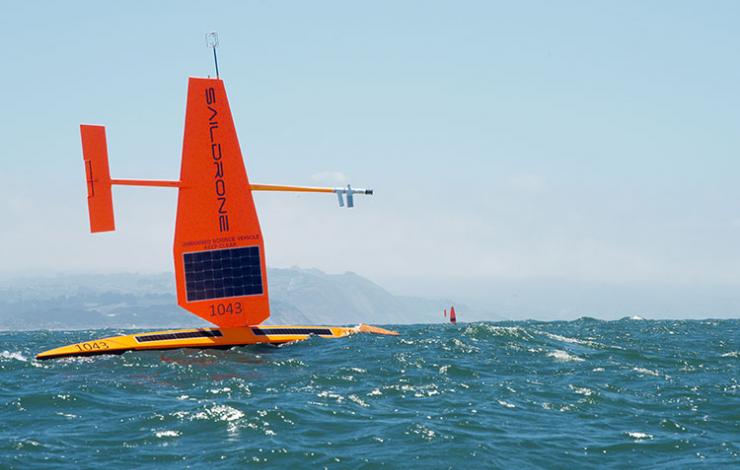
Two saildrones in the Pacific Ocean just west of the Golden Gate Bridge at the start of their journey. Photo Credit: Saildrone, Inc.
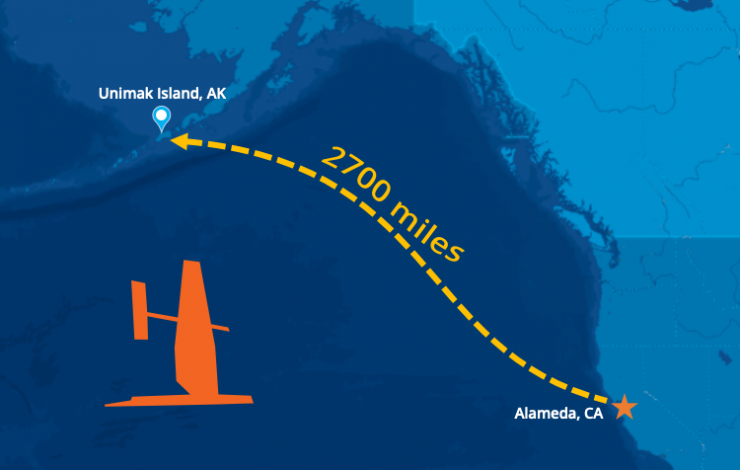
Three saildrones left Alameda, California in May and have arrived at Unimak Pass in Alaska’s remote Aleutian Islands to collect valuable abundance data to support sustainable management of the largest commercial fishery in the United States.
Three saildrones left Alameda, California in May and have arrived at Unimak Pass in Alaska’s remote Aleutian Islands. The ocean drones have sailed nearly 2,700 miles at a walking pace, about 2.5 miles per hour (2 knots), which is just about the distance from Seattle to Miami. Once they navigate through the pass, the saildrones will enter the Bering Sea. This is where they will conduct a two month-long acoustic survey of walleye pollock to collect some critically needed data to support management of the nation’s largest commercial fishery for Alaska pollock. They are expected to reach their first survey station in about a week and will cover roughly the same area normally covered by standard research vessels.
The data the drones collect will help to fill in the gap for fisheries stock assessment scientists who monitor the changes in pollock populations to advise fisheries management. The sonar measurements made by the ocean drones will provide valuable insights on pollock abundance and distribution in 2020.
The mission is led by NOAA's Alaska Fisheries Science Center with scientists at the Pacific Marine Environmental Laboratory processing the oceanographic and meteorological data in real time. Data will be made available to weather forecasts center worldwide via the World Meteorological Organization's Global Telecommunication System (GTS) so that these observations can be incorporated into weather predictions. PMEL, AFSC and Saildrone have collaborated on several missions in the Arctic since 2015 to develop the vehicle’s capabilities and refine the sensors.
The US Arctic and Bering Sea are big, remote, and harsh environments. PMEL's Innovative Technology for Arctic Exploration program and Engineering Development Division have been developing autonomous technologies and tools to collect critical data to better understand changes in the oceans and its impact on food security, sea ice forecasts, weather and climate.
Drones and gliders are not designed for ice edge and can offer a new perspective on Arctic science, exploring new areas of the Arctic Ocean. One critical area of study is the melting edge of the seasonal ice pack. The timing and speed of annual ice retreat is changing each year, and could have a big impact on ecosystems and global weather patterns. PMEL is pushing the envelope to further develop gliders and drones to advance the science near the ice edge to explore how it moves and changes.
Check out the video on our YouTube Channel to learn more about NOAA PMEL’s autonomous observing technology in the Arctic: https://youtu.be/A_
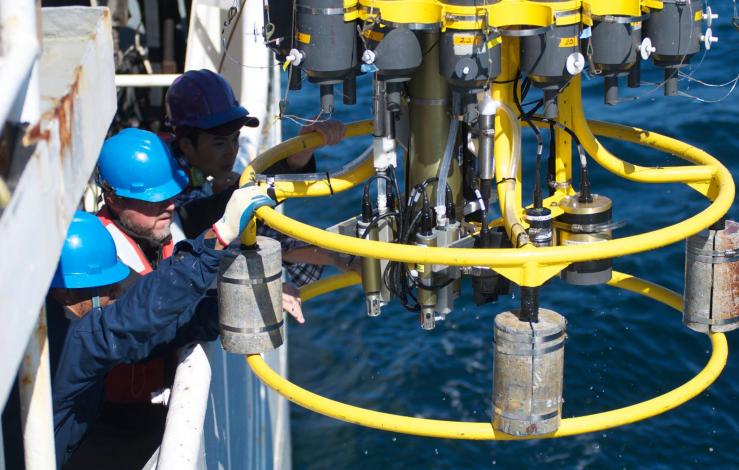
A Conductivity, Temperature and Depth (CTD) sampler is retrieved during the East Coast Ocean Acidification cruise that characterized marine carbonate parameters in the waters along the U.S. and Canadian coasts. Credit: NOAA

Scientists gather around a CTD during the West Coast Ocean Acidification Cruise to collect samples that measure concentrations of oxygen, pH, and carbon, salinity, chlorophyll and nutrients. Photo Credit: Meghan Shea/NOAA
New NOAA and partner research comparing ocean acidification around North America shows that the most vulnerable coastal waters are along the northern part of the east and west coasts. While previous research has looked at specific regions, the new study appearing in Nature Communications, is the first in-depth comparison of ocean acidification in all North American coastal ocean waters.
“Ocean acidification is everywhere, but this synthesis basically shows that, depending on the location, it can manifest very differently,” said Wei-Jun Cai, lead author and a professor at the University of Delaware School of Marine Science and Policy.
Ocean acidification, a global process in which the ocean absorbs carbon dioxide from the atmosphere, is occurring faster than at any time in the past 50 million years. The global rise in ocean acidity is fueled by human-created greenhouse gases. An estimated 25 percent of those emissions are absorbed by the ocean.
In the ocean waters off the United States east coast, the northbound Gulf Stream current brings warm waters from the tropics while the southbound Labrador Current brings cold waters from the Arctic and subarctic regions. The colder ocean temperatures along the northern part of the east coast take up more carbon dioxide from the atmosphere than do warmer waters along the southern east coast and Gulf of Mexico. This uptake of carbon dioxide accelerates ocean acidification, which can hamper the ability of shellfish, corals and other valuable marine species to build their shells and thrive.
On the west coast, ocean acidification is affecting the waters of the California Current, which extends from the United States - Canadian border to Baja California. The California Current is characterized by strong, cold currents, and wind-driven upwelling events. Upwelling brings colder, carbon-dioxide-rich subsurface waters to the ocean’s surface to replace surface water that has been pushed away by winds.
“The water from the subsurface has low pH and high carbon dioxide, which causes stress to the biological system,” said co-author Richard Feely of NOAA’s Pacific Marine Environmental Laboratory (PMEL). “So the combination of the uptake of anthropogenic carbon dioxide from the atmosphere and the upwelling of CO2-rich low-pH water from below leads to enhanced acidification in this region.”
The research team from NOAA, the University of Delaware, and scientists from Canada, Mexico, the United Kingdom, China and Taiwan based the new findings on data gathered during several research cruises between 2007 and 2018. A number of those cruises were led or supported by NOAA’s Pacific Marine Environmental Lab, Atlantic Oceanographic and Meteorological Lab and the Ocean Acidification Program. Other PMEL authors include Simone Alin, Jessica Cross, Brendan Carter (UW/JISAO) and Adrienne Sutton.
Read the full news release from the University of Delaware.
Read the paper in Nature Communications (an open access journal): Controls on surface water carbonate chemistry along the North American ocean margins
The coronavirus pandemic response has reduced pollution from a large number of sources across many geographic regions. NOAA has launched a wide-ranging research effort to investigate the impact of reduced vehicle traffic, air travel, shipping, manufacturing, and other activities on Earth's atmosphere and oceans. Researchers are using the most advanced atmosphere-ocean models to look for changes in atmospheric composition, weather, climate, and precipitation over weeks to months. In the oceans, NOAA scientists will be assessing impacts of reduced underwater noise levels on marine life.
PMEL along with NOAA Fisheries Office of Science and Technology, NOAA Sanctuaries and Department of Interior’s National Park Service are collaborating to analyze data from hydrophones deployed around the United States coastal waters to measure changes and assess any impacts on fisheries and marine mammal activity due to reduced maritime transportation and other maritime activities.
Read the full story from NOAA Research.

Tsunami test scenario for Bellingham (upper panel) and Tacoma (lower panel) forecast models. Tsunami amplitudes and inundation (red) are shown for the same M9.0 scenario of the Cascadia tsunami 3 hours after tsunami generation. Click on image to see both panels. These figures do not represent an actual forecast or quantitative hazard assessments for Tacoma and Bellingham, these are rather a test simulation of a potential tsunami scenario to verify the robustness of the forecast models.
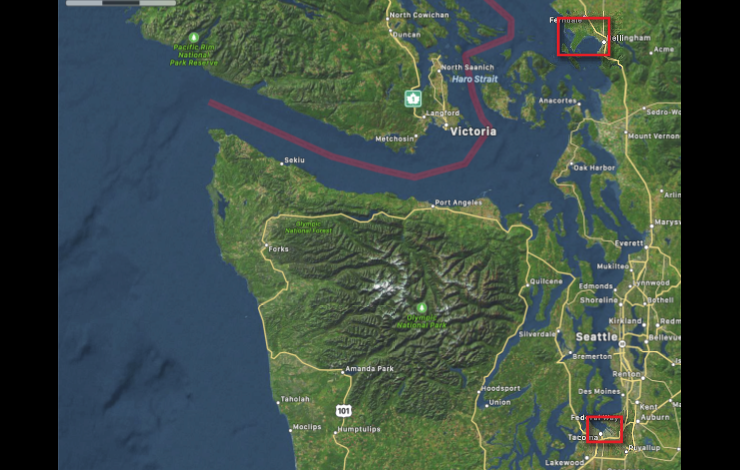
Locations of Bellingham and Tacoma forecast models. Inundation model computational domains are shown as red rectangles.
The main tsunami hazard for Washington State originates from a potential earthquake at the Cascadia Subduction Zone, which is stretched along the U.S. Pacific coasts offshore Washington, Oregon and Northern California. The main impact during such a tsunami event would be the ocean-side communities on the open coast. However, Washington State’s main population centers are located along Puget Sound, a long narrow inlet over 100 miles away from open coast and from potential Cascadia earthquake.
Recent tsunami mapping and tsunami hazard modeling efforts of the National Tsunami Hazard Mitigation Program have demonstrated that a Cascadia tsunami impact could be significant even for the coasts deep inside Puget Sound. Due to this need, the NOAA Center for Tsunami Research (NCTR) at PMEL developed high resolution tsunami inundation forecast models for Bellingham and Tacoma, Washington. These high-resolution community models are needed to improve the accuracy of the tsunami forecasts at NOAA’s Tsunami Warning Centers. Since 2012, NCTR has developed over 75 high-resolution inundation forecast models for the most vulnerable U.S. coastal communities and that number continues to grow.
While the tsunami wave amplitudes in Bellingham and Tacoma are expected to be lower in comparison with the outer coast communities during a Cascadia tsunami, the population density and potential local tsunami-genic faults within Puget Sound make these two cities high tsunami risk. Seattle would also see some impact but was not found to be as high risk from tsunami inundation as Tacoma or Bellingham.
The development of the Tacoma and Bellingham models included extensive testing with available historical tsunami data and included the dynamics from major harbor structures such as breakwaters. The forecast models are also constrained by run time and are developed to run in less than a minute. Figure 2 shows an example of model testing results, depicting snapshots of tsunami amplitudes for a Cascadia tsunami simulation 3 hours after a generated tsunami event. Tacoma wave amplitudes may reach above 5 meters for this scenario, while Bellingham shows above 4 meters of amplitudes for this scenario.
These models have been incorporated into real-time forecasting at the NOAA Tsunami Warning Centers. Prior modeling efforts used worst case scenarios and long-running higher resolution models for WA state emergency managers to develop evacuation plans for a Cascadia tsunami event.
NCTR is an integral part of the NOAA Tsunami Program and is involved in several tsunami hazard mitigation and risk reduction research programs with federal, state and international partners.
Read more about the methods and details about the forecast system here.
Aerosols are fine particles that are produced by waves breaking at the ocean surface (sea spray), phytoplankton (sulfate aerosol), sandstorms (dust), and combustion (burning of fossil fuels and wildfires). These microscopic particles can impact climate directly by absorbing or scattering incoming solar radiation and indirectly by affecting cloud properties such as extent, lifetime, and reflectivity. Aerosols also affect air quality by reducing visibility and, when inhaled, can affect our health.
The Atmospheric Chemistry Group at NOAA’s Pacific Marine Environmental Lab has been studying the effects of aerosols on climate and air quality by participating in shipboard national and international research field campaigns and long-term aerosol monitoring for over thirty years. Their work has employed the use of ships, unmanned aerial systems (UAS), and ground stations.
The group has studied a broad range of aerosol types ranging from remote marine aerosols in every ocean basin, black carbon (soot) in the Arctic, particulate matter in the oil and gas fields of Utah’s Uintah Basin to dust storms over Asia.
Check out our video on the NOAA YouTube Channel to learn more about NOAA PMEL’s research on aerosols: https://www.youtube.com/watch?v=pp_TdS8RPZI


