What's New Archive
NOAA’s Ernest F. Hollings Undergraduate Scholarship (Hollings) and the Education Partnership Program with Minority Serving Institutions (EPP/MSI) Undergraduate Scholarship Program are now accepting applications through January 31.
The Hollings Scholarship and EPP/MSI program recognize outstanding undergraduate students studying in fields that support NOAA’s mission. The scholarships provide funds for two years of undergraduate study to rising junior undergraduate students majoring in Science, Technology, Engineering and Mathematics (STEM) fields such as biological, social, and physical sciences, mathematics, engineering, computer and information sciences, and teacher education.
Student scholars also receive one (Hollings) or two (EPP) paid summer internship opportunities at NOAA facilities across the US. The internship provides hands-on, practical experience in NOAA-related science, research, technology, policy, management, and education activities. Each summer, PMEL hosts several undergraduate students in our Seattle, WA and Newport, OR locations. Past research projects at PMEL have included work on ocean acidification, hydrothermal vents, acoustics, arctic aerosols, and ocean heat content.
These opportunities are designed to prepare students for careers as environmental scientists and educators, and to increase public environmental and ocean literacy and stewardship of the ocean and atmosphere.
Applications are due Wednesday, January 31st, 2018, at 11:59 PM EST and are accepted through an online system. For more information, visit the NOAA Education website.
Other student opportunities with PMEL can be found here including the National Science Foundation Research Experience for Undergraduate (NSF-REU) program and the University of Washington’s JISAO summer internship program.
Dr. Richard Feely of NOAA's Pacific Marine Environmental Laboratory has been named a Fellow of the American Association for the Advancement of Science (AAAS). Election as a AAAS Fellow is an honor bestowed upon AAAS members by their peers. This year 396 members have been awarded this honor by AAAS because of their scientifically or socially distinguished efforts to advance science or its applications.
As part of the Section on Atmospheric & Hydrospheric Sciences, Dr. Feely was elected as an AAAS Fellow for leading the scientific examination of the acidification of oceans and shifting public policy to address this environmental issue.
Dr. Feely has been with PMEL for over 43 years and currently is a senior scientist and project leader of the Ocean Carbon group. He is an active member on many national and international committees and serves as a mentor to graduate students and post-doctoral fellows. He has authored more than 290 scientific research publications. He’s logged over 1,000 days at sea on more than 50 scientific expeditions, most recently as part of the West Coast Ocean Acidification cruise in 2016.
Read the full announcement in the AAAS News and Notes section of the journal Science.
November 10 - December 18: Nine PMEL scientists from the Earth-Ocean Interactions (EOI) Program are studying the submarine volcanoes in the southwest Pacific Ocean aboard the Schmidt Ocean Institute's R/V Falkor on an expedition being led by Dr. Ken Rubin of the University of Hawaii. Major support for the expedition is from NOAA’s Ocean Exploration and Research Program.
The Falkor and the science team are in the Northeast Lau Basin off of Tonga, a region known to have a very high density of submarine volcanoes. It is estimated that there are 30 discrete volcanoes in a 50 X 50 km area. During the two-part cruise, they will be using the Autonomous Underwater Vehicle (AUV) Sentry to generate high resolution bathymetric maps of the area and then later explore these areas with the Remotely Operated Vehicle (ROV) SuBastain.
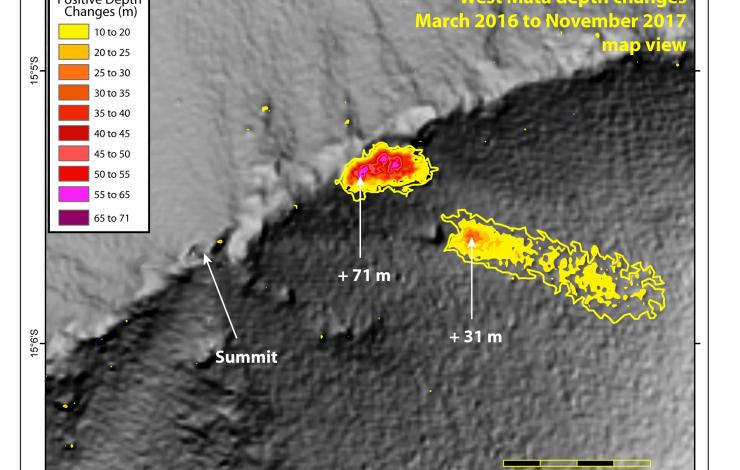
In 2008 at West Mata seamount, water column data showed strong evidence of an active eruption which was later confirmed with an ROV response cruise in 2009. West Mata represents an extraordinary opportunity to learn about the interactions between the earth and the deep ocean that can have important impacts on ocean geochemistry and marine ecosystems. And with West Mata’s frequent activity, there is always a chance that they will be lucky enough to catch it erupting again.
The team is already finding evidence for two new eruption sites at West Mata seamount since March 2016, in addition to 5 other recent eruption sites between 2009-2016. This makes West Mata one of the most active submarine volcanoes known on the planet.
Follow along with the cruise logs, read more about the expedition, and meet the science crew at Schmidt Ocean Institute’s web site: Underwater Fire: Studying the Submarine Volcanoes of Tonga

Study area and reference zones for freeze onset (a), Sea Surface Temperature (SST) (b), and ALAMO deployment area (c). AXBT and radiometer SST data were collected over the region between Bering Strait and the northern shelf break. Reference area (a) was selected because of the availability of oceanographic moorings and ship-based CTD data along the PMEL Icy Cape and Distributed Biological Observatory lines that will be available for data validation and other future research.
PMEL is initiating an experimental sea ice fall freeze-up outlook for northern Alaskan waters. The 2017 freeze onset on the Chukchi Sea continental shelf northwest of Icy Cape will begin near the end of November to the first week of December. This is approximately 36 days later than the long-term observed mean (1981-2016).
PMEL researchers with the Arctic Heat Open Science Experiment Based used observations from Air-Launched Autonomous Micro-Observer (ALAMO) floats, deployed in the summers of 2016 and 2017, Airborne EXpendable BathyThermograph (AXBT) arrays deployed in the region that measure ocean temperature as a function of depth from aircraft, and satellite data to project when sea ice freeze up will occur in the Chukchi Sea in 2017.
Float data reveal in real time the presence of ocean heat not detectable by satellite, and provide continuous monitoring of transport, water column stability, and cooling rate. This information is not otherwise available from other observing systems.
Read more about the rationale and data used here. For more information and data, visit the Arctic Heat website: https://www.pmel.noaa.gov/arctic-heat/.
In a new study published in Science, NOAA and NASA scientists used space-borne observations of carbon dioxide (CO2) from NASA’s Orbiting Carbon Observatory-2 satellite, or OCO-2, to characterize the tropical atmospheric CO2 response to the strong El Niño event of 2015-2016. The El Niño provided NASA and NOAA an unprecedented opportunity to test the effectiveness of this new observation tool. OCO-2 is NASA’s first satellite designed to measure atmospheric carbon dioxide with the precision, resolution, and coverage necessary to quantify regional carbon sources and sinks.
Observations of carbon dioxide concentrations over the tropical Pacific from the satellite were validated by data from NOAA’s Tropical Pacific Observing System of buoys, which directly measure carbon dioxide concentrations at the surface of the ocean. Both observing systems showed that in the early months of the El Niño, during the spring of 2015, outgassing of carbon dioxide over the tropical Pacific Ocean significantly declined by 26 to 54 percent.“This response is consistent with what we expect from a theoretical understanding, and comparable to what the NOAA data suggests,” said Richard Feely, senior scientist at NOAA’s Pacific Marine Environmental Laboratory, who is a co-author on the paper.
This research is part of a series of studies to better understand the growth of carbon dioxide concentrations in the global atmosphere using the new NASA satellite. The studies show how various regions contribute to those emissions or serve as sinks, absorbing carbon dioxide emissions at different times.
After 60 days in the Bering Sea, the Oculus Coastal Glider was successfully recovered by crew of the NOAA Ship Oscar Dyson on September 26, 2017. The glider successfully navigated 242.8 nautical miles, completed 3612 dives, and sampled salinity, temperature, dissolved oxygen, sunlight, and fluorescence at a frequency of approximately 3 dives per hour. The glider was tested in a region with a long history of shipboard and mooring observations that provide context for the Oculus glider's observations. Oculus glider measurements reveal detailed information in a known, important biogeographical transition that divides the ecosystems of the northern and southern Bering Sea shelf near St. Matthew Island. Measurements show unexpected ocean mixing in the water column near the island that may be due to internal waves. Data, sensor, and platform analysis is ongoing. Incorporating this higher resolution sampling into the Bering Sea observing network will improve our understanding of how these features affect the ecosystem.
The Oculus is a coastal glider engineered to work in the highly stratified, shallow depths of the Arctic. By using a rapid buoyancy system, the glider can change buoyancy states 20 times faster and achieve speeds three times faster than legacy gliders - allowing for a more efficient and adaptive Arctic survey, but transferable to a variety of markets.
This was the second field test for the Oculus coastal gliders. The first field test occurred early May 2017, also in the Bering Sea, with 387 dives completed near the M2 mooring site. For the second field test, the glider was deployed from the US Coast Gaurd Cutter Healy during the 2017 Arctic Shield mission.
The Oculus was developed at PMEL in partnership with the University of Washington's Joint Institute for the Study of the Atmosphere and Ocean and the University of Washington Seaglider Fabrication Lab.
NOAA’s Pacific Marine Environmental Lab and Paul G. Allen Philanthropies have teamed up in a groundbreaking partnership to expand Deep Argo ocean observations to improve our understanding of weather, climate and potential improve prediction of sea level rise. Deep Argo expands on the success of the Argo array but will dive up to 6,000 meters or 3.7 miles to collect data on temperature and salinity up in the lesser understood bottom half of the ocean.
“Putting Deep Argo floats in the western South Atlantic is another step toward a global Deep Argo array, which will illuminate key portions of our changing oceans,” said Gregory C. Johnson, PMEL oceanographer who will lead the project. “It’s like we’ve had a candle in a dark room and now we’re going to flip on the lamp. We’ll see all the details.”
Paul G. Allen Philanthropies has committed more than $4 million for the multi-year project, Jump-Starting Deep Argo. Allen’s research vessel R/V Petrel will deploy an array of these floats in the deep international waters east of Brazil. PMEL will provide scientific expertise and ongoing support of the array.
Abyssal ocean,
modulating climate change:
Deep Argo observes.
Read NOAA’s press release here.
Read Dr. Johnson’s guest blog post on paulallen.com
Two Saildrones headed to the tropical Pacific Ocean to enhance the Tropical Pacific Observing System
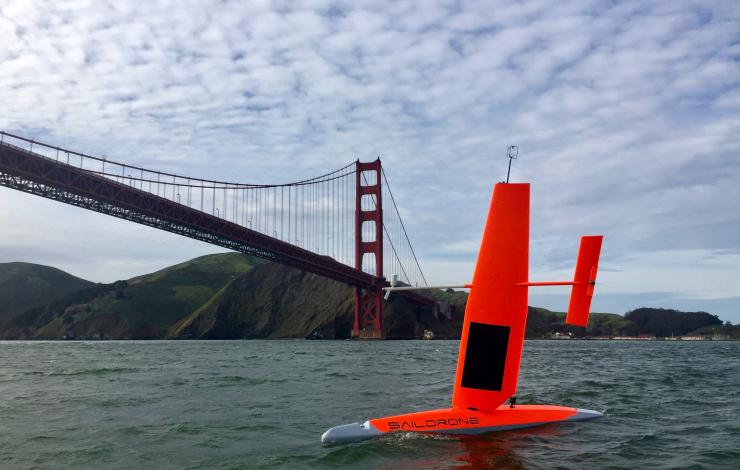
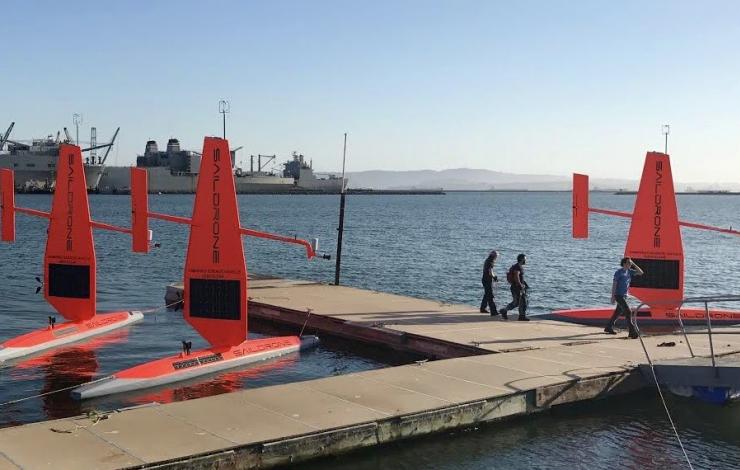
On September 1, two saildrones launched from the Saildrone Inc. dock in Alameda, CA to begin their six-month, 4,000 + nautical-mile, round-trip mission to the equator to improve the Tropical Pacific Observing System (TPOS). These saildrones are a component of a broader effort to rethink the Tropical Pacific Observing System (TPOS) that supports sub-seasonal to seasonal forecasting for the US. TPOS provides real-time data used by the US and partner nations to forecast weather and climate, including El Nino. The mission will be testing if this new, enhanced tool can collect a variety of measurements at a quality that matches research ships and proven mooring technology, Tropical Atmosphere Ocean (TAO) array. If this is the case, they may become a powerful tool to provide key observations for weather forecasts.
The saildrones are headed to the California Current Ecosystem (CCE) for a short test before taking part in a larger field study with NASA at the NASA SPURS study site in the eastern Tropical Pacific. The saildrones will perform an intercomparison with the Woods Hole Oceanographic Institution’s (WHOI) buoy and collect observational date in the study site. The saildrones will also do a calibration exercise with a research ship to ensure the accuracy and quality of the measurements that are being collected. This is particularly important to scientists when testing new sensors and technologies. Then the saildrones will travel south to the equator to do intercomparisons with the TAO moorings before heading back to Alameda, CA.
If the mission is successful, the improved data collection can help improve forecasts for El Nino’s and other weather phenomena that develop in the tropical Pacific and strongly impact North American weather patterns.
Read more about the Saildrone missions in the Arctic and the Tropical Pacific here.
Watch the launch on CBS San Francisco here.

The image is of ocean surface temperature in 2016 compared to the 1981-2010 average. Despite the weakening 2015/16 El Niño event in 2016, the global average sea surface temperature in 2016 beat 2015 as the warmest year on record by a narrow margin. Image credit: NOAA Climate.gov map, adapted from Figure 3.1a in State of the Climate in 2016.
On August 10th, the State of the Climate in 2016 was published in a special edition of the Bulletin of the American Meteorological Society. This 27th annual report is based on contributions from more than 500 scientists representing over 60 countries around the world. It is the most comprehensive annual summary of Earth’s climate and provides a detailed update on global climate indicators, notable weather events and other data collected from locations on land, water, ice, and in space.
PMEL, including JISAO and JIMAR, scientists contributed to sections on the global ocean carbon cycle, ocean heat content and arctic air temperature.
The new report confirmed that 2016 surpassed 2015 as the warmest year in 137 years of recordkeeping. Several climate indicators also set new records in 2016, including greenhouse gas concentrations, sea level, and sea surface temperature. The Arctic also continued to warm with average Arctic land surface temperature 3.6°F (2.0°C) above the 1981-2010 average and sea ice extent and thickness remained low.
Dr. Gregory C. Johnson, PMEL oceanographer and editor for the ocean chapter, sums up in Haiku form:
Large El Niño wanes,
east Pacific tropics cool,
seas shed heat, slow rise
Read the full report, press release and report highlights.
Over the next four months, NOAA scientists will launch unmanned ocean vehicles, called Saildrones, from the Arctic to the tropical Pacific Ocean to help better understand how changes in the ocean are affecting weather, climate, fisheries and marine mammals. The wind and solar-powered research vehicles that resemble a sailboat will travel thousands of miles across the ocean, reaching some areas never before surveyed with such specialized technology.
Earlier this week, PMEL scientists and Saildrone, Inc. sent off three saildrones from Dutch Harbor, Alaska. For the first time, two saildrones will sail north through the Bering Strait into the Arctic Ocean to study how the Arctic Ocean is absorbing carbon dioxide. A third unmanned vehicle will survey more than 3,100 nautical miles in the Bering Sea for walleye pollock, Northern fur seals that prey on them and the elusive North Pacific right whale. This work will build on research conducted during 2016, including a study of fur seal feeding rates. NOAA Fisheries Alaska Fisheries Science Center scientists will also attach video cameras to fur seals to record feeding and verify the species and sizes of fish that fur seals are eating.
In September, scientists will launch two more unmanned systems from Alameda, Calif., on a six-month, 8,000-nautical-mile, round-trip mission to the equator to improve the Tropical Pacific Observing System (TPOS). TPOS provides real-time data used by the U.S. and partner nations to forecast weather and climate, including El Nino. The unmanned sailing vehicles will take part in a larger field study with NASA, and visit mooring sites along the array of observing buoys.
Read the release on NOAA Research here and follow along with the Innovative Technology for Arctic Exploration's Blog for the Bering and Chukchi Seas missions.


