Feature Publication Archive
Many of the PMEL staff stopped by the NOAA booth to give lightning talks and network with other NOAA staff.
Buck, J.J.H., et al. (2019): Ocean data product integration through innovation—The next level of data interoperability. Front. Mar. Sci., 6, 32, Oceanobs19: An Ocean of Opportunity. https://doi.org/10.3389/fmars.2019.00032
Tanhua, T., et al. (2019): Ocean FAIR Data Services. Front. Mar. Sci., 6, 440, Oceanobs19: An Ocean of Opportunity. https://doi.org/10.3389/fmars.2019.00440
Vance, T.C., et al. (2019): From the oceans to the cloud: Opportunities and challenges for data, models, computation and workflows. Front. Mar. Sci., 6, 211, Oceanobs19: An Ocean of Opportunity. https://doi.org/10.3389/fmars.2019.00211
Meinig, C., et al. (2019): Public private partnerships to advance regional ocean observing capabilities: A Saildrone and NOAA-PMEL case study and future considerations to expand to global scale observing. Front. Mar. Sci., 6, 448, Oceanobs19: An Ocean of Opportunity. https://doi.org/10.3389/fmars.2019.00448
Meyssignac, B., et al. (2019): Measuring global ocean heat content to estimate the Earth energy imbalance. Front. Mar. Sci., 6, 432, Oceanobs19: An Ocean of Opportunity. https://doi.org/10.3389/fmars.2019.00432
Roemmich, D., et al. (2019): On the future of Argo: A global, full-depth, multi-disciplinary array. Front. Mar. Sci., 6, 439, Oceanobs19: An Ocean of Opportunity. https://doi.org/10.3389/fmars.2019.00439
Sloyan, B., et al. (2019): The Global Ocean Ship-Base Hydrographic Investigations Program (GO-SHIP): A platform for integrated multidisciplinary ocean science. Front. Mar. Sci., 6, 445, Oceanobs19: An Ocean of Opportunity. https://doi.org/10.3389/fmars.2019.00445
OceanObs’19 was held in Honolulu, Hawaii, in September 2019. The conference presented a unique forum to share new ideas and concepts in marine data management and to emphasize the opportunities presented by a rapidly changing technology landscape. The OceanObs’19 conference was designed to bring: “… people from all over the planet together to communicate the decadal progress of ocean observing networks and to chart innovative solutions to society’s growing needs for ocean information in the coming decade.”
OceanObs’19 community white papers (CWPs) included the input of nearly 2,500... more »

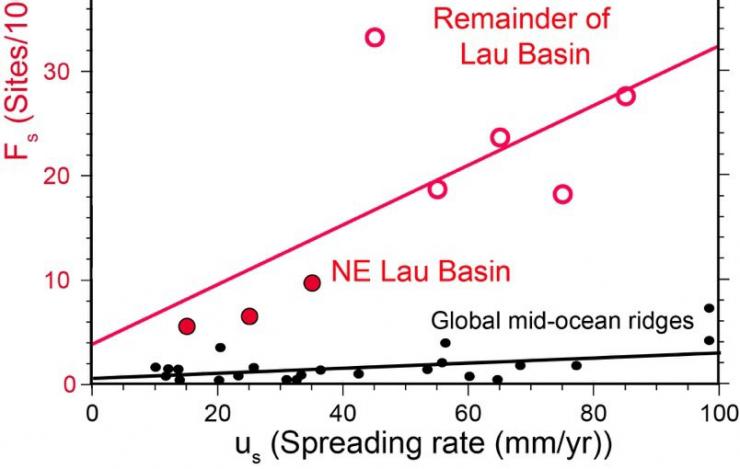
Relationship between the spreading rate of ridges and the spatial density (sites/100 km) of active hydrothermal sites on a given ridge segment. Higher spreading rates produce a greater magma supply to drive hydrothermal venting. In the Lau Basin, site production is ~10x higher than on other mid-ocean ridges. Red box in inset: NE Lau Basin.
Baker, E.T., S.L. Walker, G.J. Massoth, and J.A. Resing (2019): The NE Lau Basin: Widespread and abundant hydrothermal venting in the back-arc region behind a superfast subduction zone. Front. Mar. Sci., 6, 382, Pacific Deep-Sea Discoveries: Geological and Biological Exploration, Patterns, and Processes. doi: 10.3389/fmars.2019.00382
Fluids in the Earth’s crust are heated by magma rising to the seafloor where tectonic plates separate or collide. These discharging fluids cool hot rock, construct mineral deposits, nurture biological communities, alter deep-sea mixing and circulation patterns, and profoundly influence ocean chemistry and biology. Since the discovery of deep-sea hydrothermal vents in 1979, scientists have identified more than 700 sites where fluids presently emerge from the seafloor. Over the subsequent 40... more »

Saildrone SD1006 starting its journey from San Francisco, California, to the SPURS-2 region in the eastern tropical Pacific.
Zhang, D., M. Cronin, C. Meinig, T. Farrar, R. Jenkins, D. Peacock, J. Keene, and A. Sutton (2019): Air-sea flux measurements from a new unmanned surface vehicle compared to proven platforms during SPURS-2 field campaign. Oceanography, 32(2), 122–133, doi: 10.5670/oceanog.2019.220.
With the ability to transit thousands of kilometers while making surface observations similar to a moored buoy, the unmanned surface vehicle (USV) Saildrone, manufactured and piloted by Saildrone, Inc., could contribute in important ways to the Global Ocean Observing System (GOOS). Saildrones are powered by renewable energy, using wind for propulsion and solar energy for vehicle control, sensor operation, on-board data processing, and real-time data telemetry. Through a Cooperative Research and Development Agreement (CRADA) between PMEL and Saildrone, sensors for measuring 22 Essential... more »

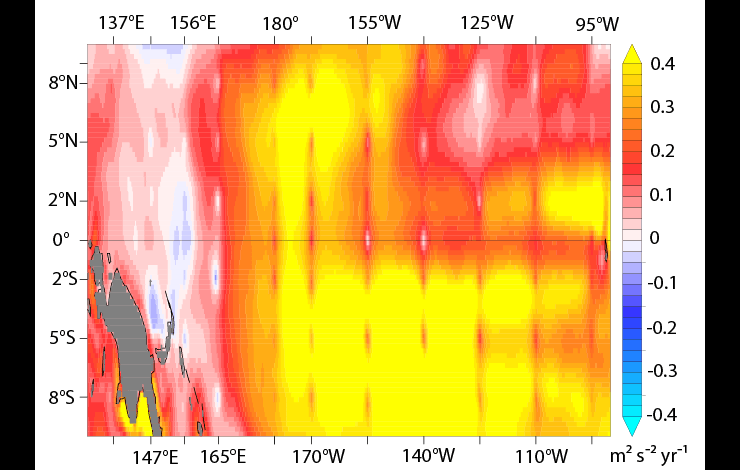
The 25-year trend in wind speed squared over the tropical Pacific calculated from a popular wind analysis product (Cross-Calibrated Multi-Platform Wind Analysis Version 2, period 1992-2016).
Chiodi, A. M., J. P. Dunne, and D. E. Harrison ( 2019). Estimating air‐sea carbon flux uncertainty over the tropical Pacific: Importance of winds and wind analysis uncertainty. Global Biogeochemical Cycles, 33, 370– 390. doi: 10.1029/2018GB006047
About half of carbon emissions are currently absorbed by natural processes taking place on land and in the ocean. But not all regions of the Earth’s surface act as a sink for emitted CO2. The tropical Pacific Ocean stands out as a significant source of carbon to the atmosphere—even rivaling U.S. emissions. Understanding how this source has changed over recent decades, and how it might change in coming decades is important to understanding and predicting net carbon uptake by the oceans.
Changes in wind speeds over the tropical Pacific Ocean surface are one way in which the... more »

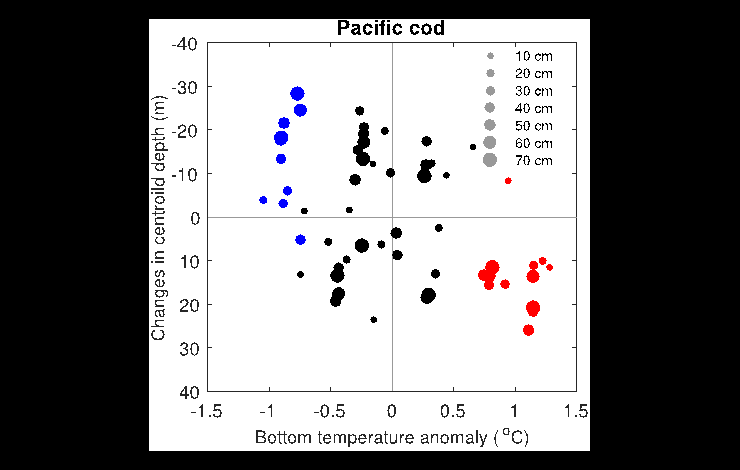
This diagram shows that Pacific cod were caught deeper in warm years (red dots), and shallower in cold years (blue dots), than in near-average years (black dots, average temperature ±1 standard deviation). This is a plot of the deviations in the depth about the mean depth where Pacific cod were caught versus the bottom temperature anomaly (the difference between the temperature in a single year and the multi-year average temperature). The larger the dot, the longer the fish (see scale at top right).
Yang, Q., E. D. Cokelet, P. J. Stabeno, L. Li, A. B. Hollowed, W. A. Palsson, N. A. Bond, and S. J. Barbeaux (2019): How "The Blob" affected groundfish distributions in the Gulf of Alaska. Fish. Oceanogr. https://doi.org/10.1111/fog.12422
In 2014-2016, a marine heat wave, also known as the Blob, produced abnormally warm waters off the US West Coast and in the Gulf of Alaska. Temperatures in the upper 100 meters of the ocean were more than 2.5° C higher than the long term (1981–2010) average from satellite, buoy and ship observations. Many important commercial fish species are groundfish that may not be affected by warm water near the surface. Oceanographers and fisheries scientists from the University of Washington’s Joint Institute for the Study of the Atmosphere and Ocean and NOAA’s Pacific Marine Environmental Laboratory... more »


