
|
|
| ||||||||||||||||
|
|
. | Welcome | ||||
|
More information: Flash animation
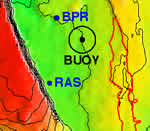
of how the NeMO Net system works: Map of ASHES hydrothermal vent field |
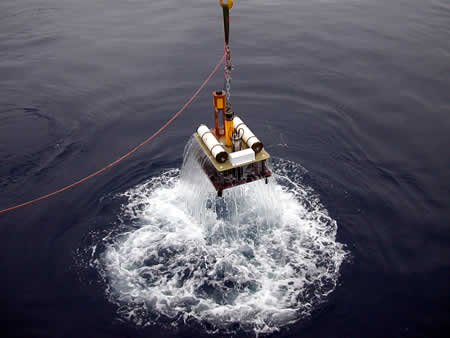
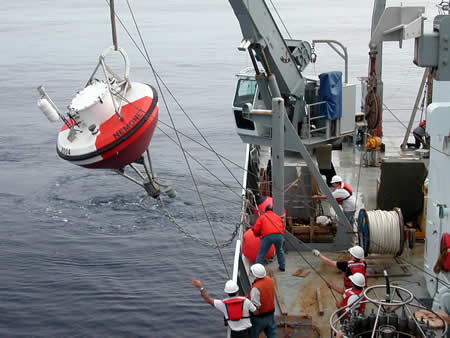
The NeMO Net system uses acoustic modems to relay data from seafloor instruments to a buoy at the surface, which in turn sends the data to NOAA's Pacific Marine Environmental Laboratory via satellite. In 2004-5, two instruments on the seafloor were linked into NeMO Net: a Remote Access Sampler (RAS) in the ASHES vent field, and a Bottom Pressure Recorder (BPR) near the center of the caldera. The map above shows the locations of the instruments and the NeMO Net buoy. The plots below show some of the data that has been transmitted from the seafloor. Update: In May 2005, the RAS was retrieved to recover water samples, but the BPR remained deployed. In December 2005, the batteries powering the acoustic link on the buoy expired (which was expected because the buoy had been deployed since September 2004). In 2006 the buoy became lost at sea. Our current plan is to keep monitoring instruments deployed at Axial in 2006-7, but without the buoy link in order to work on enhancements to the system. |
|||||
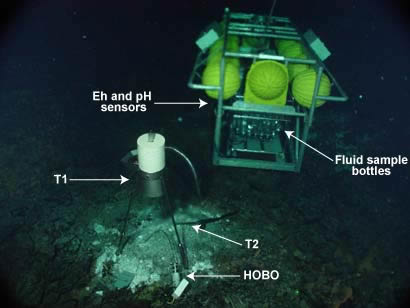
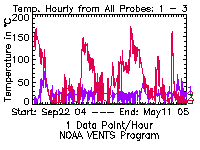
| . | Temperature Data (RAS) | |||||
|
More
information: Download Data (temperature only) |
| |||||
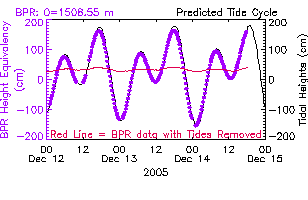
| . | Bottom Pressure Recorder (BPR) | |||||
|
|
|
|||||
| . | The NeMO Net buoy | |||||
|
|
|
| Major funding for NeMO Net provided by: | Pacific Marine Environmental Laboratory | West Coast National Undersea Research Center |
| NeMO Home |About NeMO | Expeditions | NeMO Net | Explore | Dive! | Education |
