 |
| |
||||||||||||||||
|
|||||||||||||||||||||||||||||||||||||||||||||||||||||
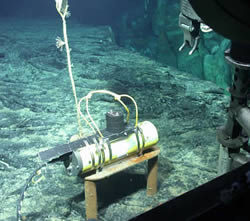
 Pressure benchmark outside of Axial's caldera, down south at an eruptive fissure from the 1998 lava flow. (click image for larger view) |
Axial Seamount is an active volcano that lies along the Juan de Fuca Ridge, a spreading center where new seafloor is being created at a rate of about 6 cm per year. It is also the site of enhanced magma supply from the mantle, as it is the newest in a line of hotspot seamounts similar (albeit smaller) than the Hawaiian Islands. Axial seamount accommodates a significant portion of the seafloor spreading that occurs on this segment of the ridge through diking events and eruptions. Between eruptions, molten material flows from deeper sources into the depleted magma chamber. This movement of magma within the crust often results in deformation of the Earth’s surface. This subsurface movement of molten material can be tracked and quantified by measuring and mapping out the pattern of surface deformation. On land this can be accomplished using a variety of techniques. One very useful technique is GPS. However, most of the earth’s volcanic systems lie below the oceans as mid-ocean ridges or seamounts. Satellite techniques (such as GPS) that are used on land cannot be used to track the movement of the seafloor since the electromagnetic waves these methods use cannot penetrate the oceans. Therefore it is much more difficult to measure the movement of the seafloor than that of land.
We’ve developed a technique at Axial in which we use water pressure on the seafloor to determine changes in depth of the seabed. For example, if a point on the seafloor moves vertically upward, there will be a little bit less water directly over that point. This will cause a small decrease in the water pressure measured at that point. Since we know the density of seawater, this pressure decrease can be converted to a change in the depth of that point. The primary source of error in these measurements is from the ocean tides, which can change by 2 meters in the span of 6 hours! To eliminate the effects of ocean tides from our measurements we use both tide models and direct tidal measurements.
A pressure gauge located in the center of the caldera recorded over 3 meters of subsidence during the last eruption of Axial Seamount in 1998. The pressure record also showed a very rapid rise of the caldera floor immediately following the eruption. Since then the caldera has been steadily inflating as a result of the magma chamber refilling. The results of this year’s measurements show that the center of the caldera has uplifted by 10 cm since last year. It has been uplifting at this rate for the last several years. The overall uplift since the 1998 eruption is about 2 m.
Eruptions are thought to occur every 10-20 years at Axial. We are hoping to capture a full eruption cycle with these ongoing measurements. This would allow us to begin to directly characterize this magmatic system and see correlations to changes in the hydrothermal vents and the life it makes possible. These measurements could improve our ability to forecast eruptions, monitor magma supply rates, and quantify the depth and size of the magma chamber under the volcano.
.
|
Sep/Oct 2004
| ||||||
| S | M | T | W | T | F | S |
| 12 | 13 | 14 | 15 | 16 | 17 | 18 |
| 19 | 20 | 21 | 23 | 24 | 25 | |
| 26 | 27 | 28 | 29 | 30 | 1 | 2 |
Today's Events:
Jason dive J2-293 at ASHES ends.
Atlantis moves to Cobb.
|
Today's
photos |
|
click
caption for larger view |
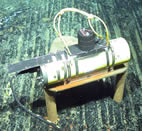
 Benchmark at the Marker 33 site on a sheet flow. |
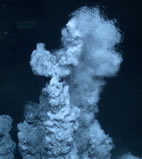
 Virgin Vent at the ASHES vent field . |
| NeMO Home |About NeMO | Expeditions | NeMO Net | Explore | Dive! | Education |