|
Total Commercial Industrial Residential Mobile Power Plant |
 |
 |
 |
 |
 |
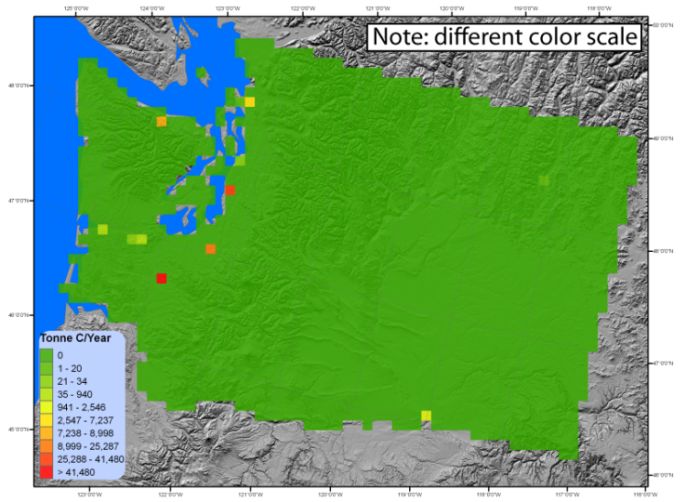 |
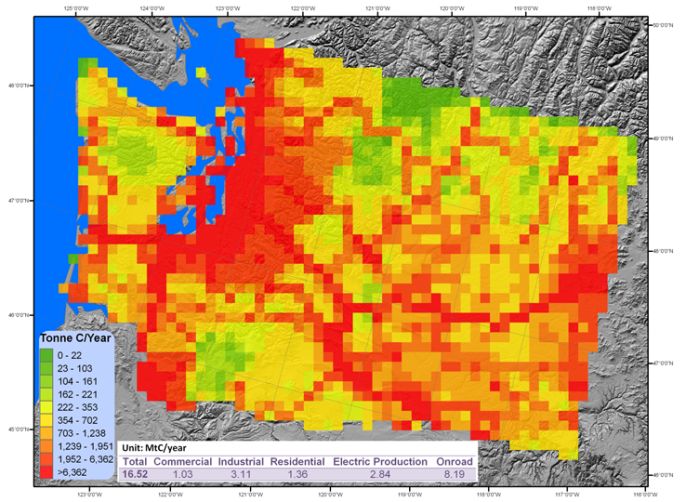
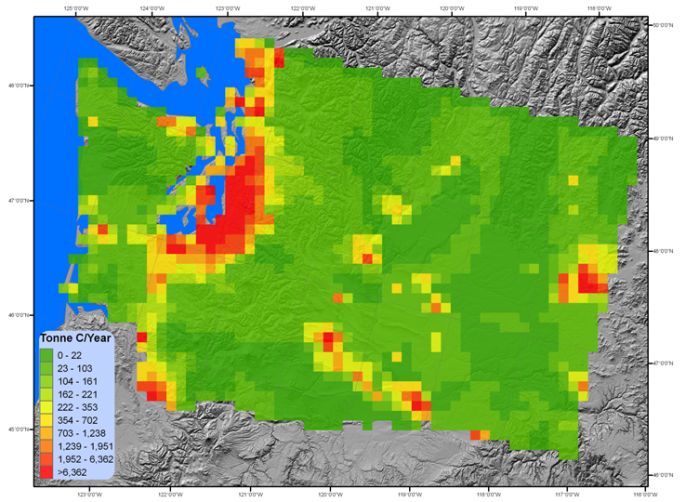
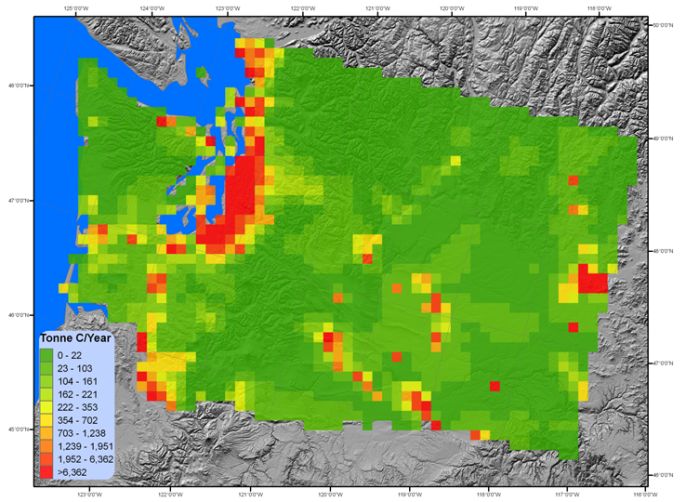
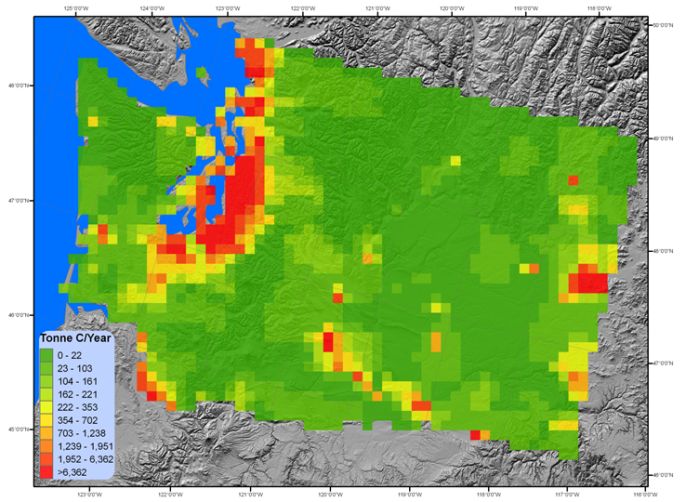
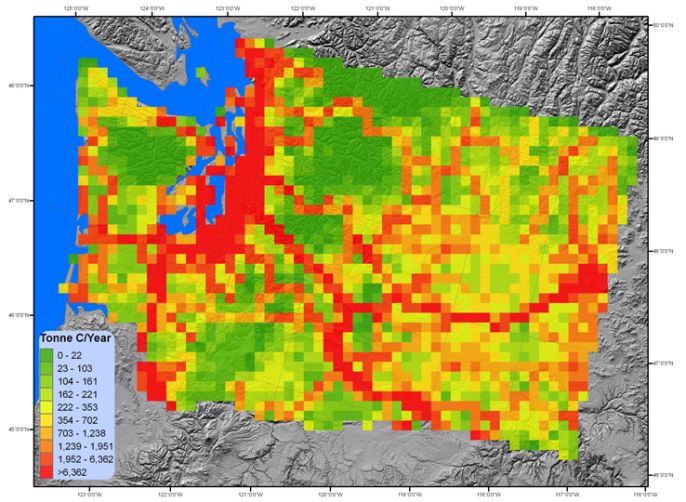
Many different human activities result in fossil fuel emissions The Vulcan fossil fuel CO2 emissions inventory is constructed by researchers at Purdue University from a variety of data sources with particular emphasis on data compiled by the United States Environmental Protection Agency (EPA) for the year 2002. Here we show maps of the emissions from various activities for Washington State. The maps show the fossil fuel emissions in tons of carbon per year for each 10 km x 10 km box in the state.
- Total = total fossil fuel emissions for each 10 km x 10 km area in tons of carbon per year. This plot also shows a table of the state wide total emissions for each category in Millions of Tons of carbon per year.
- Commercial = fossil fuel emissions from businesses.
- Industrial = fossil fuel emissions from factories and other large industries.
- Residential = fossil fuel emissions from homes.
- Mobile = fossil fuel emissions from both on road (e.g. cars) and off road ( e.g. trains, aircraft) vehicles.
- Power Plant = fossil fuel emissions from electric generating plants. Note that power plants that do not use fossil fuels as a power source (e.g. hydroelectric plants) will not show up in this plot.
These figures show that the largest sources of emissions in Washington State are from cars, trucks and other mobile CO2 sources. While a few individual power plants are large point sources of CO2 (see power plant figure and note color scale), there are relatively few fossil fuel powered electric generation plants in Washington so the net total source of CO2 for power generation in Washington State is relatively low compared to other states. Note also that most of the emissions are associated with population centers (i.e. cities) or the roads connecting those cities.
Figures provided by K. Gurney and Y. Zhou (Purdue University), text provided by C. Sabine (NOAA/PMEL).

