LDEO Surface Ocean CO2 Climatology
measurements help us to understand the patterns of carbon uptake and release in the ocean
The LDEO database is regularly updated to include the latest information. To find the latest LDEO compilations visit the Carbon Dioxide Information Analysis Center.
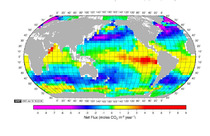
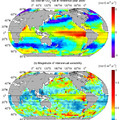
In 1997, Taro Takahashi (Lamont Doherty Earth Observatory) compiled 30 years worth of surface ocean CO2 observations (~ 250,000 measurements) to produce the first monthly global surface pCO2 maps (Takahashi et al., Proc. Natl. Acad. Sci., 94, 8292–8299, 1997). This compilation included a significant amount of data contributed by the PMEL carbon group. By the time Takahashi updated his climatology in 2002, the surface pCO2 database had grown to more than 940,000 measurements (Takahashi et al., Deep-Sea Res. II, 49, 1601–1622, 2002). The latest map of surface CO2 values, based on nearly 3 million measurements collected between 1970 and 2007, has been constructed with a spatial resolution of 4 degrees of latitude and 5 degrees of longitude for a reference year 2000 (Takahashi et al., Deep-Sea Res. II, 56, 554–577, 2009). the latest dataset includes both underway and moored data from the PMEL carbon group.
Of the major ocean basins, the Southern Hemisphere oceans, south of 14°S to Antarctica, is the largest CO2 sink taking up about 1.1 Pg-C/yr, while the northern oceans north of 14°N take up about 0.7 Pg-C/yr. The equatorial oceans, 14°N–14°S, emit 0.7Pg-C/yr to the atmosphere. The net uptake flux for the global oceans is estimated to be 1.6 +/- 0.9 Pg-C/yr. Taking the pre-industrial steady-state ocean release of 0.4 +/- 0.2 Pg-C/yr into account, the total ocean uptake flux for anthropogenic CO2 emissions is estimated to be 2.0 +/- 1.0 Pg-C/yr in the reference year 2000.
The PMEL carbon group has been providing data and working closely with Dr. Takahashi over the years to improve the global climatology maps. The data are available at https://www.nodc.noaa.gov/ocads/oceans/LDEO_Underway_Database/.

