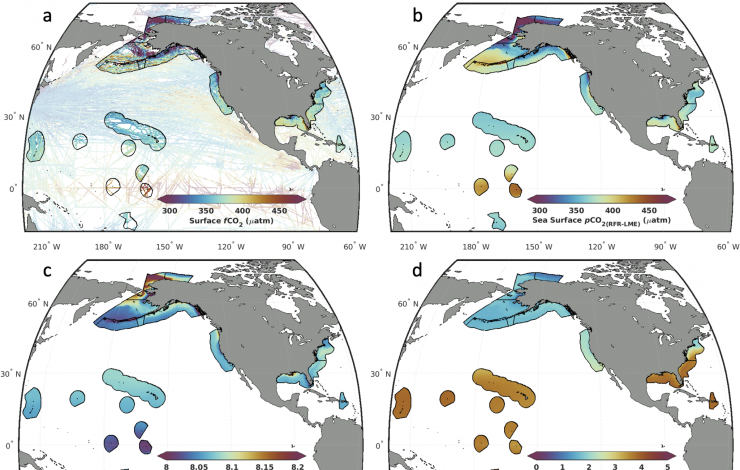
(a) Long-term averages (1998-2022) of surface ocean CO2 fugacity observations from SOCATv2023, binned into 0.25° × 0.25° monthly grid cells, which are used in the development of RFR-LMEs. (b-d) Long-term averages (1998-2022) of monthly RFR-LME maps of surface ocean (b) CO2 partial pressure, (c) pH on the total scale, and (d) calcium carbonate saturation state with respect to aragonite.
Sharp, J.D., L.-Q. Jiang, B.R. Carter, P.D. Lavin, H.L. Yoo, and S. Cross (2024): A mapped dataset of surface ocean acidification indicators in large marine ecosystems of the United States. Sci. Data, 11, 715, doi: 10.1038/s41597-024-03530-7.
Humans generate about 36 billion tons of carbon dioxide pollution every year, about 30 percent of which are absorbed by the oceans. While that means there's less carbon dioxide (CO2) heating the atmosphere, the result is that the chemistry of the ocean is changing in profound and damaging ways, especially for marine organisms that grow hard shells.
Now, scientists from NOAA and two cooperative institutes have developed spatially and temporally consistent maps of ocean acidification indicators covering U.S. large marine ecosystems (LME) from 1998 to 2022. The work was led by University of Washington CICOES and NOAA PMEL researcher Jon Sharp and co-authored by PMEL researcher Brendan Carter. It was published in the Nature journal Scientific Data in July.
These new maps allowed the research team to conclude that between 1998 and 2022, all 11 U.S. large marine ecosystems—ocean regions of 200,000 square kilometers or more—have experienced CO2 partial pressure (pCO2) increases and pH decreases that are broadly consistent with global ocean acidification trends.
The indicators, developed with data from the Surface Ocean CO2 Atlas (SOCAT) and with machine learning approaches to fill gaps in the observational coverage, include pH, pCO2, and calcium carbonate saturation states for monthly timesteps from 1998 to 2022. Plotted on a 0.25° by 0.25° spatial grid, the data products are called RFR-LMEs (after the random forest regression approach for the LMEs).
The RFR-LMEs have been averaged into regional timeseries to summarize the status of ocean acidification in U.S. coastal waters, information that is disseminated on the NOAA Ecowatch dashboard. RFR-LMEs show a domain-wide CO2 partial pressure increase of 1.4 ± 0.4 µatm yr-1 and pH decrease of 0.0014 ± 0.0004 yr-1.
These OA indicators rely heavily on NOAA observations, like those collected by the Surface Ocean CO2 Observing Network, to provide the spatial resolution needed for LME-wide indicators. Observations from the United Nations Global Ocean Acidification Network, in particular those from moored buoy systems, provide the temporal resolution that help ensure RFR-LMEs capture monthly variability in ocean acidification indicators, especially in the coastal ocean. "We wanted to build from these critical in situ observations," says Sharp, "to produce an accessible resource for evaluating the progression of ocean acidification in ecologically and economically important U.S. marine ecosystems."
These indicators will inform local to regional studies of ocean acidification, provide a resource for interested groups and rights holders to monitor their ecosystems of interest, and deliver simple snapshots of ecosystem status with respect to ocean acidification. This work is funded by NOAA's Ocean Acidification Program.
Data from this publication may be accessed via the NOAA National Centers for Environmental Information (NCEI) repository.


