2008 Central Lau Basin
Heat transported from the mantle beneath spreading centers creates an astonishingly narrow ribbon of convective heat discharge at plate boundaries, as apparently demonstrated by exhaustive exploration for hydrothermal discharge sites over the last three decades. Recent observations and models are now challenging this assumption of exclusively axis-centric high-temperature venting. One example is the proposal that intense cooling along the vertical boundaries of a broad low-velocity volume (LVV) of hot crust could generate high-temperature fluids several kilometers off axis. To test the hypothesis that substantial hydrothermal discharge might occur beyond the LVV, we conducted a dense survey grid of the ridge and surrounding seafloor (up to ±5 km) along 175 km of the Eastern Lau Spreading Center and Valu Fa Ridge (~1800 km of trackline). Our sampling array extended from ~50 to 400 m above bottom and included light-scattering, oxidation-reduction potential, and hydrographic sensors attached to the tow line and beneath the IMI120 sonar mapping system. The surveys successfully mapped plumes from several vent fields in the neovolcanic zone (~±1.5 km about the axis) but did not detect evidence of significant discharge anywhere farther off-axis. The results thus do not support a simple picture of high-temperature fluids ascending undiluted through the crust to the seafloor several kilometers off-axis. However, we cannot exclude the possibilities that the largely unmapped LVV is narrower here than seen on other ridges, that hydrothermal fluids formed beyond the LVV are channeled to the axis, or that discharge beyond the neovolcanic zone occurs only as dispersed, very-low-temperature fluids. Our observations do demonstrate that high-temperature discharge predominantly exits the seafloor within a narrow (~±1.5 km) axial ribbon, regardless of the presence or absence of an axial magma chamber.
Baker, E. T., F. Martinez, J. A. Resing, S. L. Walker, N. J. Buck, and M. H. Edwards (2010), Hydrothermal cooling along the Eastern Lau Spreading Center: No evidence for discharge beyond the neovolcanic zone, Geochem. Geophys. Geosyst., doi:10.1029/2010GC003106. (PDF)
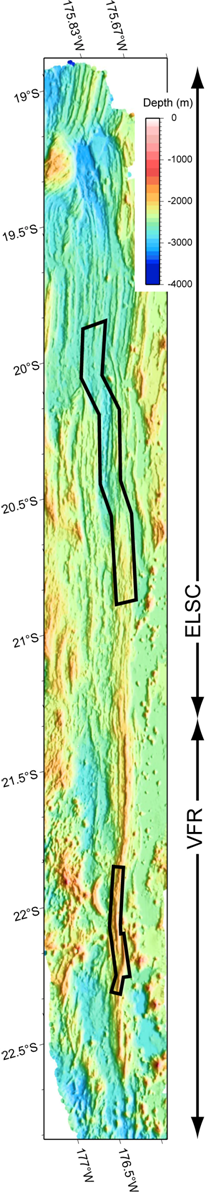
Bathymetry of the ELSC and VFR. Black polygons show our study areas.
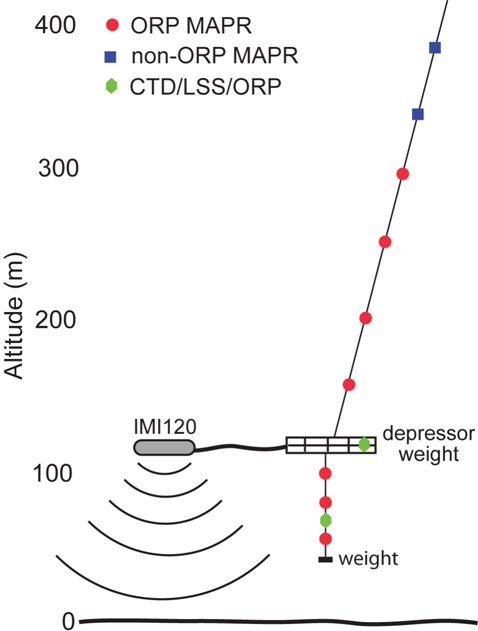 Schematic diagram of the typical survey array. MAPRs were attached to the IMI120 towline above the depressor weight, with additional MAPRs and a CTD package suspended below the depressor. Additional sensors were also mounted on the depressor weight. The depressor altitude was targeted at ~120 m, but varied by 10s of meters up or down depending on the local bathymetry and operational constraints. ORP=oxidation-reduction potential sensor, LSS=light-scattering sensor.
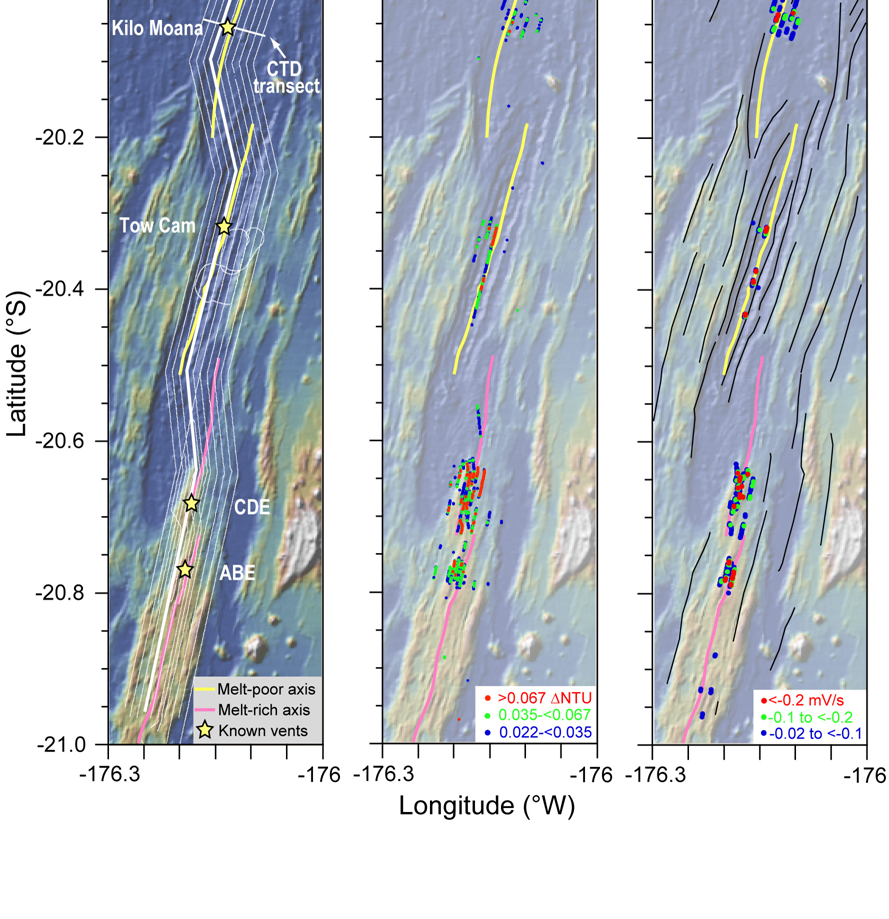
(A) Bathymetry (from GeoMapApp) of the Eastern Lau Spreading Center area, showing survey tracks (thin white lines) and CTD transect at Kilo Moana (heavy white cross-axis line). Note increased survey density around ABE and CDE. (B) Each dot represents the maximum ∆NTU from all MAPRs at a given 15 s sampling interval. All sample points with ∆NTU anomalies >0.022 are plotted. Sample dots are colored according to ∆NTU intensity. (C) Same as (B), but for dE/dt (where E is the oxidation-reduction potential in mV). All sample points where dE/dt <-0.02 mV/s are plotted. Note that there are many fewer dE/dt anomalies than ∆NTU anomalies. Thin black lines show major faults.
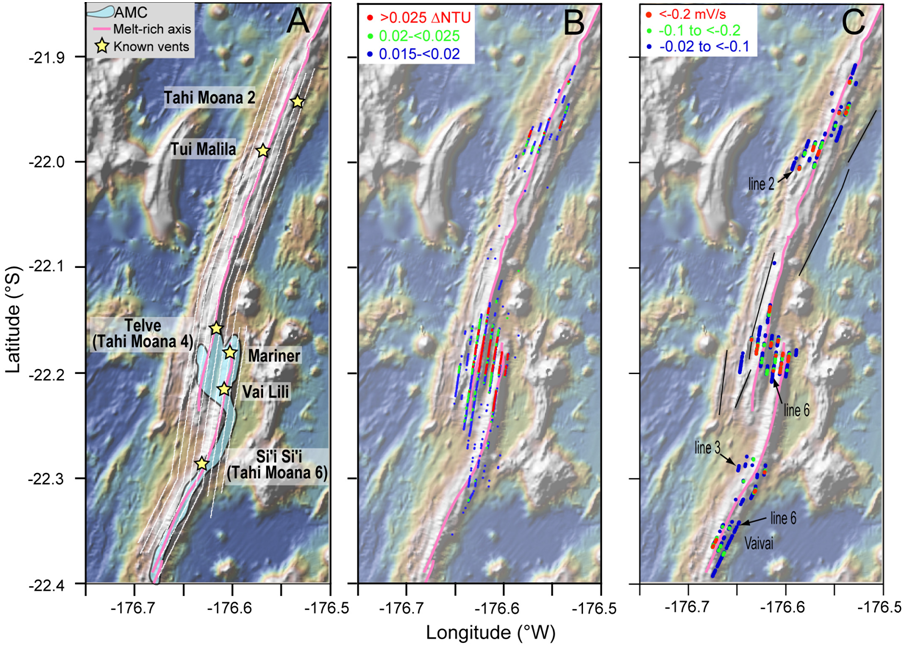
(A) Bathymetry (from GeoMapApp) of the Valu Fa Ridge area, showing survey tracks (thin white lines). (B) Each dot represents the maximum ∆NTU from all MAPRs at a given 15 s sampling interval. All sample points with ∆NTU anomalies >0.015 are plotted. Sample dots are colored according to ∆NTU intensity. (C) Same as (B), but for dE/dt (where E is the oxidation-reduction potential in mV). All sample points where dE/dt <-0.02 mV/s are plotted. Note that there are many fewer dE/dt anomalies than ∆NTU anomalies. Thin black lines show major faults. Also shown are the locations of off-axis dE/dt anomalies and the inferred vent field Vaivai.