Long-Term Tilt Rates
This page displays long-term rates of tilt, calculated using data from the LILY tiltmeters on the BOTPT instruments at Axial Seamount, as part of the National Science Foundation's (NSF) Ocean Observatories Initiative (OOI) Cabled Array seafloor observatory, operated by the University of Washington. The dates/times below are in GMT (+8 hrs of local standard time, or +7 hrs of DLS time on the US west coast).
LINK BACK TO PAGE WITH MAPS AND OTHER INSTRUMENTS
Long-Term Tilt Rates (post-2015-eruption re-inflation)
The plots below show the long-term tilt rates, from each of the four BOTPT instruments, calculated from 1-day means of the LILY tiltmeter data over time, with tilt magnitude calculated since 28 June 2015, and re-leveling offsets removed. Note there are still some remaining offsets in the LILY tilt time-series that may be due to minor instrument shifts on the seafloor. These lead to short-term apparent decreases in tilt rate, which should be ignored. However, other pauses or reversals in the tilt rate are real. Note that these plots only plot cumulative tilt magnitude and ignore tilt direction. There are three plots for each of the BOTPT instruments, showing the calculated tilt rates for the last 2 weeks, how these rates have varied over the last 12 months, and since the 2015 eruption. These plots are updated once a day.
BOTPT-A301-MJ03F - Central Caldera
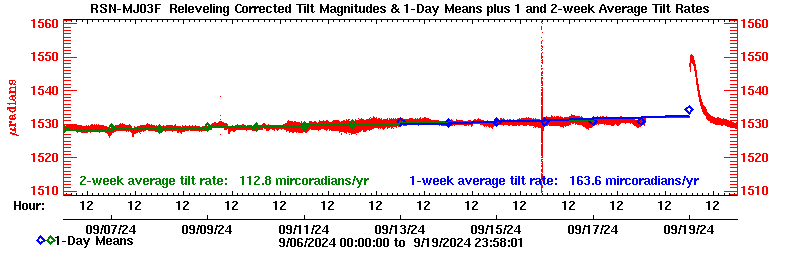
Plot 1: Plot of long-term rates of tilt calculated from the last 1- and 2-weeks.
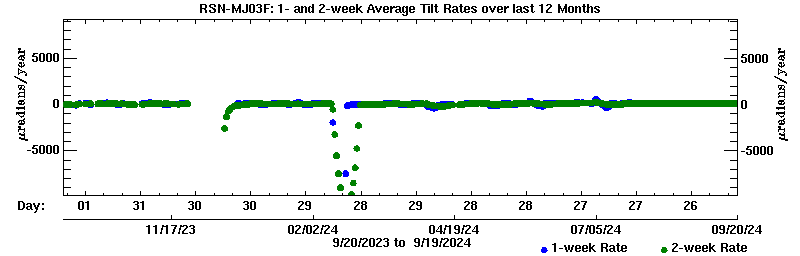
Plot 2: Plot of how the long-term tilt rates have varied over the last 12 months.
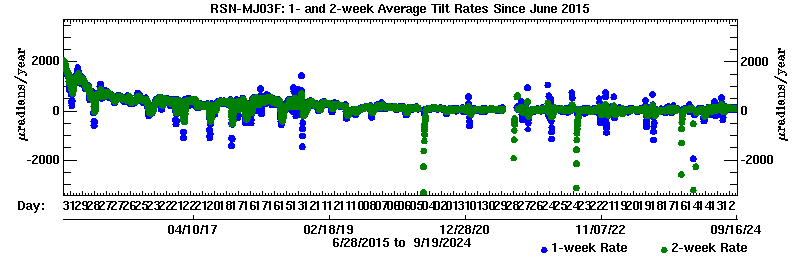
Plot 3: Plot of how the long-term tilt rates have varied since 28 June 2015.
BOTPT-A302-MJ03E - Eastern Caldera
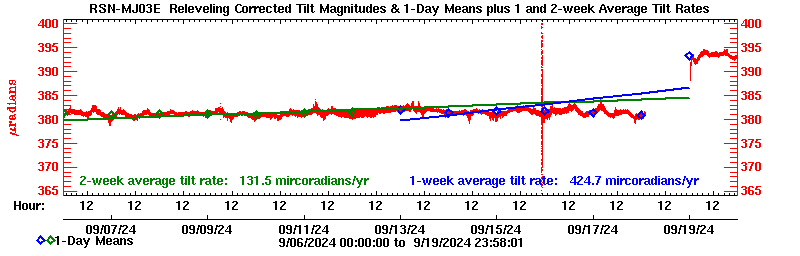
Plot 4: Plot of long-term rates of tilt calculated from the last 1- and 2-weeks.
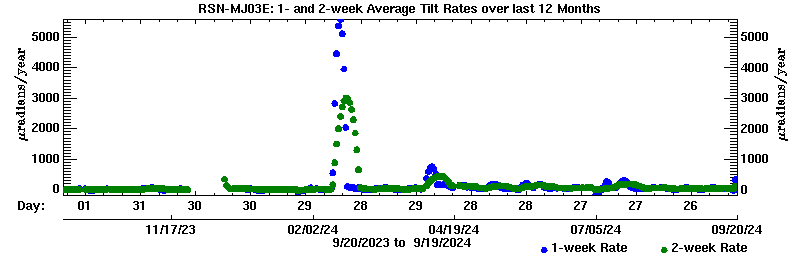
Plot 5: Plot of how the long-term tilt rates have varied over the last 12 months.
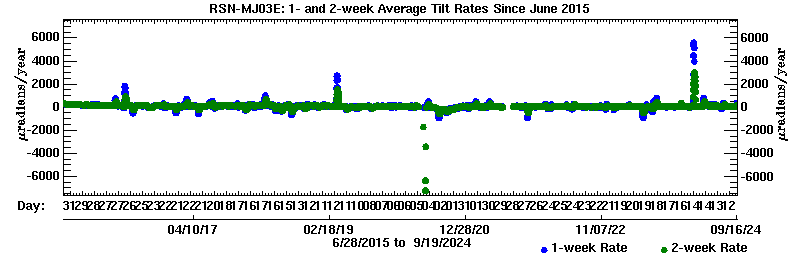
Plot 6: Plot of how the long-term tilt rates have varied since 28 June 2015.
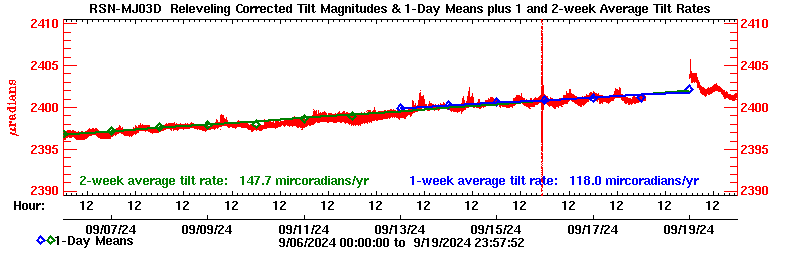
BOTPT-A303-MJ03D - International District
Plot 7: Plot of long-term rates of tilt calculated from the last 1- and 2-weeks.
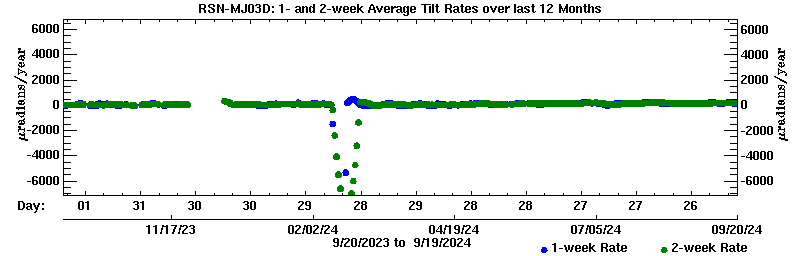
Plot 8: Plot of how the long-term tilt rates have varied over the last 12 months.
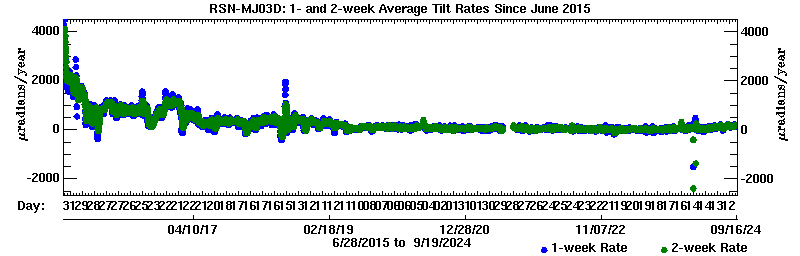
Plot 9: Plot of how the long-term tilt rates have varied since 28 June 2015.
BOTPT-A304-MJ03B - ASHES Vent field
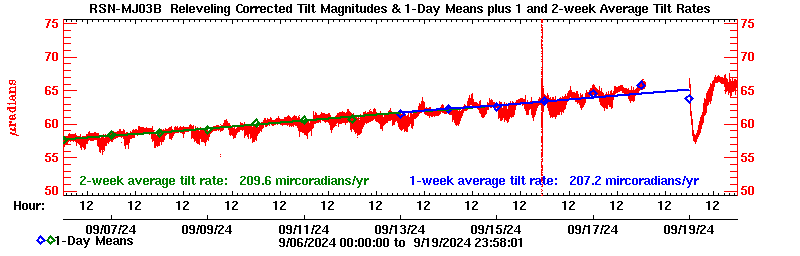
Plot 10: Plot of long-term rates of tilt calculated from the last 1- and 2-weeks.
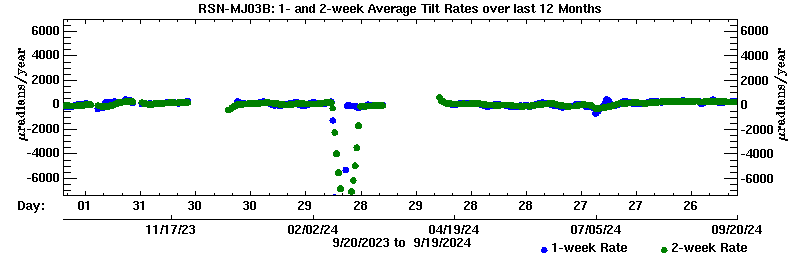
Plot 11: Plot of how the long-term tilt rates have varied over the last 12 months.
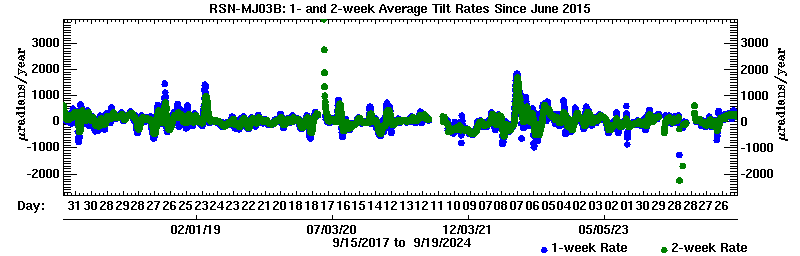
Plot 12: Plot of how the long-term tilt rates have varied since 15 September 2017 (after it was installed).
More information
National Science Foundation | The Ocean Observatories Initiative | Cabled Array Observatory
Required OOI disclaimer: This is provided as pre-commissioned data intended for scientific use, and is subject to the OOI Data Policy. This data has not been through Quality Assurance checks.
Required NSF disclaimer: This material is based upon work supported by the National Science Foundation. Any opinions, findings, and conclusions or recommendations expressed in this material are those of the author(s) and do not necessarily reflect the views of the National Science Foundation.