Realtime data from Eastern Caldera Seafloor CTD
(MJ03E-CTDPFB306)
This page displays plots of near-real-time data (updated every 15 minutes) from the seafloor CTD instrument located at the Eastern Caldera site at Axial Seamount, part of the National Science Foundation's (NSF) Ocean Observatories Initiative (OOI) Cabled Array seafloor observatory, operated by the University of Washington. The seafloor CTD at the Eastern Caldera was installed in August 2020. The instrument samples at 1 Hz, but the data are downsampled to every 1 minute in the plots below. The dates/times in the plots below are in GMT (+8 hrs of local PST, or +7 hrs of PDT time on the US west coast).
LINK BACK TO MAIN PAGE
Temperature data
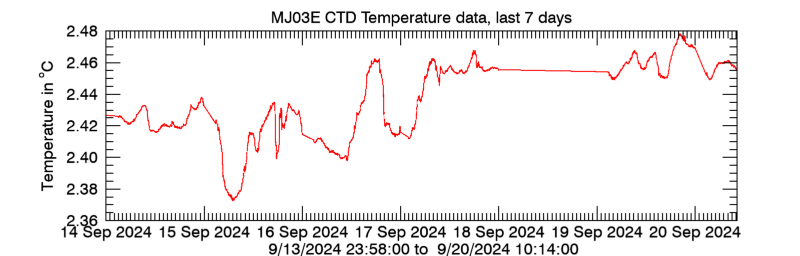
Plot 1: CTD temperature data, over the last 7 days, updated every 15 minutes.
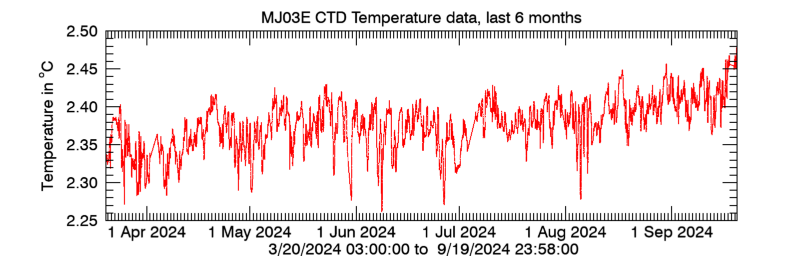
Plot 2: CTD temperature data, over the last 6 months. ONLY UPDATED ONCE PER DAY.
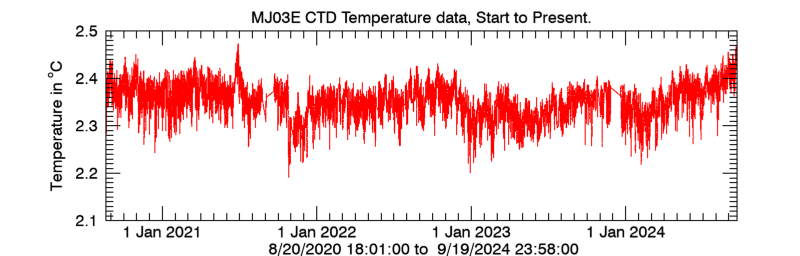
Plot 3: CTD temperature data, over the entire record. ONLY UPDATED ONCE PER DAY.
Salinity data
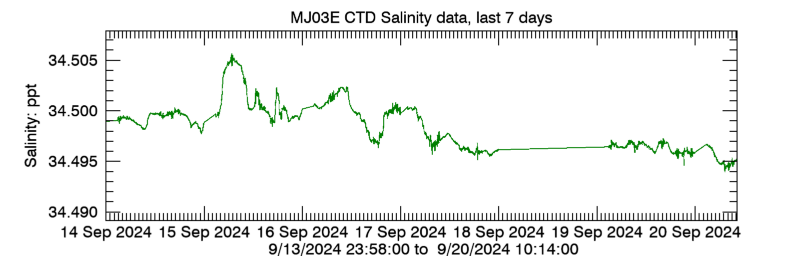
Plot 4: CTD salinity data, over the last 7 days, updated every 15 minutes.
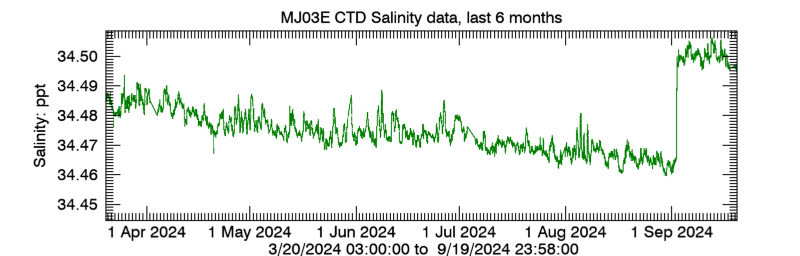
Plot 5: CTD salinity data, over the last 6 months. ONLY UPDATED ONCE PER DAY.
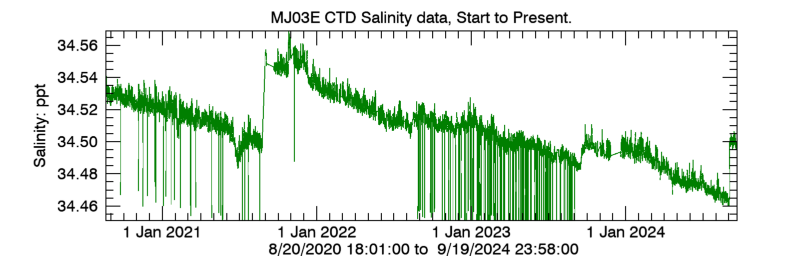
Plot 6: CTD salinity data, over the entire record. ONLY UPDATED ONCE PER DAY.
Density data
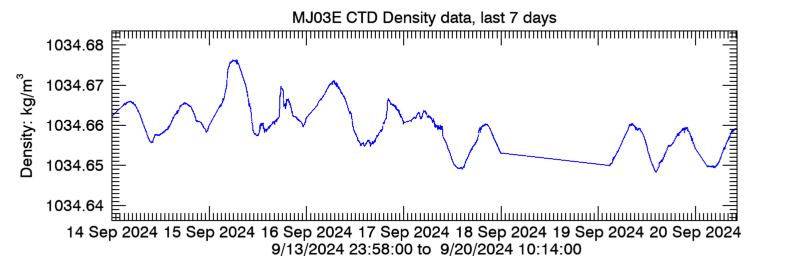
Plot 7: CTD density data, over the last 7 days, updated every 15 minutes.
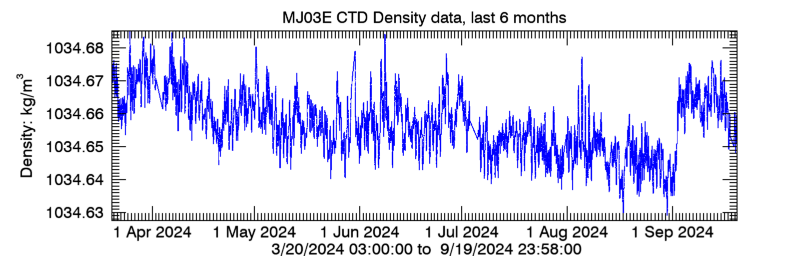
Plot 8: CTD density data, over the last 6 months. ONLY UPDATED ONCE PER DAY.
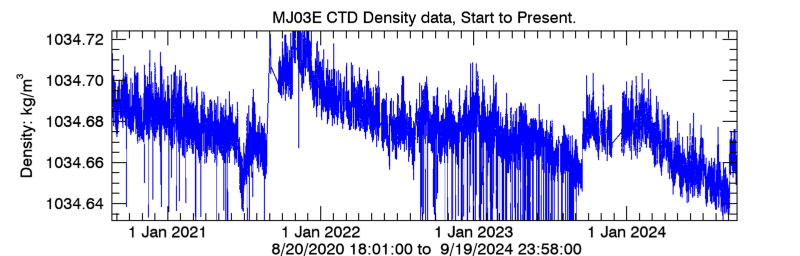
Plot 9: CTD density data, over the entire record. ONLY UPDATED ONCE PER DAY.
More information
National Science Foundation | The Ocean Observatories Initiative | Cabled Array Observatory
Required OOI disclaimer: This is provided as pre-commissioned data intended for scientific use, and is subject to the OOI Data Policy. This data has not been through Quality Assurance checks.
Required NSF disclaimer: This material is based upon work supported by the National Science Foundation. Any opinions, findings, and conclusions or recommendations expressed in this material are those of the author(s) and do not necessarily reflect the views of the National Science Foundation.