Realtime data from the OSU BPR/Tilt instrument at MARS
Note: the BPR/Tilt instrument at MARS has now been recovered. This page displayed realtime data during the 16 months while the instrument was deployed and connected to MARS (June 30, 2010 to Nov 28, 2011).
This page displays plots of realtime data (updated every hour) from the OSU BPR/Tilt instrument connected to the MARS cable. MARS (Monterey Accelerated Research System) is a cabled observatory located in Monterey Bay, California, and operated by the Monterey Bay Aquarium Research Institute (MBARI). It is a test bed where a new generation of seafloor instruments are being tested for long-term deployment at seafloor observatories. With funding from the National Science Foundation (NSF), Oregon State University (OSU) and NOAA/PMEL have developed an instrument designed to monitor submarine volcanoes. It has sensors that can precisely measure vertical movements and tilts of the seafloor, indicators of volcano inflation or deflation that are associated with magmatic intrusions and eruptions. We plan to deploy an array of instruments like the one we are testing at MARS at Axial Seamount, an active submarine volcano that will be part of NSF's Ocean Observatories Initiative in the NE Pacific. The dates/times in the plots below are in GMT (+8 hrs of local standard time, or +7 hrs of DLS time on the US west coast).
The OSU BPR/Tilt instrument has 4 sensors: 1) a high-resolution tiltmeter (LILY), 2) a low-resolution tiltmeter, 3) a bottom pressure recorder (BPR), and 4) an experimental high-resolution pressure recorder (Nano-BPR).
Click here for PHOTOS and VIDEO of the deployment of the BPR/Tilt instrument at MARS.
High-resolution tiltmeter (LILY)
The plots below are from the high-resolution tiltmeter (LILY), with tilt data measured on two perpendicular axes in microradians, which is an extremely precise angular measure in parts per million. For example, one microradian is the amount a 1-km-long bar would be tilted, if one end were lifted up by 1 mm. The resultant tilt magnitude and direction as well as other instrument data are also shown. The LILY tiltmeter automatically re-levels itself when it gets close to being out of range (+/- 300 microradians).

Figure 1: X-axis and Y-axis tilt (in microradians), over the last 3 days

Figure 2: X-axis and Y-axis tilt (in microradians), over the entire record

Figure 3: Resultant tilt magnitude, direction, and interal compass value over the last 3 days

Figure 4: Resultant tilt magnitude, direction, and interal compass value over the entire record

Figure 5: LILY internal temperature (C), over the last 3 days

Figure 6: LILY internal temperature (C), over the entire record
High-resolution Bottom Pressure Recorder (Nano-BPR)
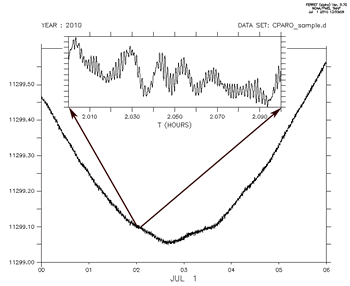
The Nano-BPR is an experimental pressure sensor made by Paroscientific with 10000 times greater resolution than a traditional BPR (like the one below), and is also capable of recording at a much higher sampling rate (we have chosen 40 Hz). We think this unprecedented precision will lead to new insights and applications in the ocean sciences, for example to better distinguish between oceanographic and seismic signals for tsunami modeling. In fact, the Nano-BPR has already detected the ground motion from several large earthquakes as far away as Chile and the Mariana trench (see link below). The plot at left shows a sample of the Nano-BPR data, and a second link below displays hourly Nano-BPR data.
Plot 7: A sample of Nano-BPR pressure data.
Additional Nano-BPR links:
Automated viewer of hourly Nano-BPR data
Earthquake signals detected by the Nano-BPR
Bottom Pressure Recorder (BPR)
The BPR precisely measures the pressure of
the overlying ocean. The raw BPR data (blue) closely
follows predicted ocean tides.
But after subtracting the tides from the BPR data, the difference (red)
can show any vertical movements of the seafloor. Three days of pressure data and the cumulative
data are displayed in separate plots, with and without tides.

Plot 8: BPR pressure data showing equivalent seafloor height (in meters), with and without tides, over the last 3 days

Plot 9: BPR pressure data showing equivalent seafloor height (in meters), with and without tides, over the entire record

Plot 10: BPR pressure data with predicted tides removed, over the last 3 days.

Plot 11: BPR pressure data with predicted tides removed, over the entire record.
Low-resolution tiltmeter
A low-resolution tiltmeter is needed to put the high-resolution tilt measurements into context. This instrument measures the tilt to the nearest degree (a million times less precise than the LILY tiltmeter), but it has a much larger dynamic range, so it shows us the gross orientation of the instrument on the seafloor. The data from this low-resolution tiltmeter are not expected to change with time, but we plot them here anyway.

Figure 12: X-axis and Y-axis low-resolution tilt (in degrees) and temperature (C), over the last 3 days

Figure 13: X-axis and Y-axis low-resolution tilt (in degrees) and temperature (C), over the entire record
More information
More information is available at these links:
NSF | MARS | The Ocean Observatories Initiative | NE Pacific Cabled Observatory | Nano-BPR Viewer
Required NSF disclaimer: This material is based upon work supported by the National Science Foundation under Grant No. 0826490. Any opinions, findings, and conclusions or recommendations expressed in this material are those of the author(s) and do not necessarily reflect the views of the National Science Foundation.

