|
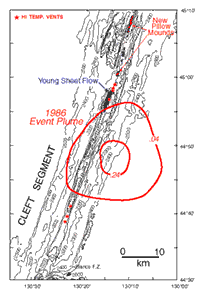
In 1986, a large plume of hot, particle laden water approximately one million cubic meters in volume was discovered over the North Cleft segment of the Juan de Fuca Ridge. This plume was unique in its shape (horizontally and vertically symmetric), size (100 km3) and rise height (~1km), indicating that an enormous volume of hot water had been released in a relatively short period of time.
|

|
||||
The size and composition of mineral particles within this plume also pointed to a large and rapid discharge of fluid, and provided evidence that the event had occurred within a few days to weeks prior to its discovery. The plume was dubbed a "megaplume." see Baker, et al (1989) and Baker, et al (1987).
Monitoring hydrothermal activity along the Cleft Segment : 1986-1997
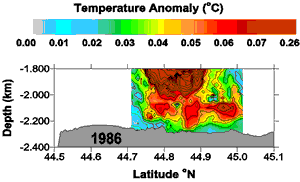
Since 1986, we have visited the Cleft Segment of the Juan de Fuca Ridge annually to monitor the distribution and intensity of hydrothermal plumes there. We have produced a primitive movie of these plumes between 1986, when the first event plume was discovered, and 1997. The movie shows the plume in terms of the hydrothermal temperature anomaly. A brief but enormous outpouring of fluid, estimated at ~100 million m3, instantaneously formed an event plume in 1986. A longer-lasting chronic plume below marked the initiation of a new vent field or the reinvigoration of an old one. The movie shows how the hydrothermal plume changes with time, subsiding after the initial event, then renewing in 1989 and 1990 with subsequent possible events, then subsiding again and remaining relatively weak through 1997.
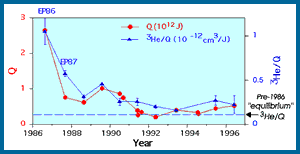
Plotted along with the heat trend is the trend of the ratio of 3He to heat. The only source of 3He is from the degassing of magma. Early studies presumed that a 3He/Q ratio of ~0.1 units was "normal" for hydrothermal systems, and suggested that if total flux of 3He out of the seafloor was known, the global flux of hydrothermal heat and other constituents could be calculated from the 3He/Q ratio, provided that global average value was also known. The change from a high 3He/Q ratio from the 1986 event plume to the lower values in subsequent years gave the first demonstration that the 3He/Q ratio in young hydrothermal systems could be an order of magnitude higher than in mature hydrothermal systems, (see Baker, E.T., and J.E. Lupton (1990)). It is now clear that a representative global value of the 3He/Q ratio cannot be determined without considering the effect of eruptions on hydrothermal discharge.
|
||||||
|
||||||


