Quality of pH Measurements in the NODC Data Archives
In order to measure changes that are due to ocean acidification we need to monitor very small pH changes in the global oceans. For example, anthropogenic carbon dioxide (CO2) has caused a pH decrease of approximately 0.1, which is about a 26% increase in the hydrogen ion concentration over the past 100 years. Monitoring these small changes requires very sensitive and reliable observations.
The NOAA National Centers for Environmental Information (NCEI) World Ocean Database has a great deal of historical pH data (nearly 1/4 million profiles; Boyer et al., 2013 – Fig. 2.11). The data collected prior to 1989 are typically not well documented and their metadata is incomplete; therefore, such data are of unknown and probably variable quality. The reasons for this are manifold (see next section). The uncertainty of these older pH measurements is rarely likely to be less than 0.03 in pH, and could easily be as large as 0.2 in pH. This data set is thus not at all well-suited to showing a change of 0.1 in pH over the last 100 years — the amount of pH change that would be expected to occur over the 100 years since the first seawater pH measurements, as a result of the documented increase in atmospheric CO2 levels and assuming that the surface ocean composition remains in approximate equilibrium with respect to the atmosphere.
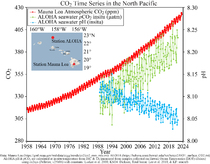
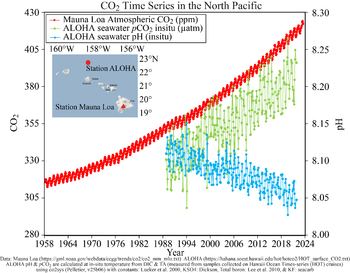
It is only since the 1990s that it has been possible to discern small pH changes in the ocean with reasonable confidence. The figure in Feely (2008, updated version shown above) shows the changes in pH inferred from measured changes in the seawater carbonate system seen off Hawaii since 1988, when a regular time-series study was instituted there using the best available methods for measuring CO2 changes in seawater. A limited number of other time-series stations have shown a similar pattern (Rhein et al., 2013; Bates et al., 2014).
Issues related to pH measurement technique and data reporting in the pre-1990 era
While seawater pH measurements have been made on some oceanographic expeditions starting with the first measurements that were made by Sørensen and Palitzsch (1910), most of the earlier data have proven to be problematic for a number of reasons that we will describe below. In addition, there is the added problem of data sparseness in any given year for the earlier data sets, which makes the determination of a global annual mean value for a particular time period to be quite challenging, necessarily increasing its likely uncertainty.
During the period from 1910 thru 1988 the most common method for measuring pH was the potentiometric method using hydrogen ion sensitive glass electrodes coupled with a reference electrode (Dickson, 1993a). This method suffers from a number of measurement and calibration issues (i.e., temperature of measurement and conversion to in situ temperature, calibration for use in a high ionic strength medium, glass electrode drift, reference electrode drift, and liquid junction potential issues) that have led to significant measurement uncertainties that are difficult to quantify adequately. In recent years the spectrophotometric pH method described by Byrne and Breland (1989) has been shown to be about one order of magnitude more precise. Its accuracy has been improved over the years since then.
Over the years, pH has been expressed on one of four different scales: (1) the total hydrogen scale, [H+]T; (2) the free hydrogen scale [H+]F, (3) the seawater scale, [H+]SW, and (4) the NBS scale aH(NBS) (Dickson, 1984; Zeebe and Wolf-Gladrow, 2007). The differences in the respective pH values can be significant. For example, for a seawater condition of salinity = 35 and temperature = 25°C the difference between pHT and pHNBS is greater than 0.1. The exact difference cannot be determined easily as it is, to some extent, dependent on the exact design of the liquid junction used in the potentiometric pH cell. Unfortunately, a large number of the earlier data sets submitted to the National Ocean Data Center does not include any information indicating how pH was calibrated (and thus the pH scale being used).
All of the earlier (before 1975) glass electrode measurements (and many more recent ones) were calibrated against NBS style buffers with an ionic strength of 0.1 mol kg–1. The liquid junction potential of the pH cell is sensitive to ionic strength and to the composition of the solution it is in, so moving the electrodes from these low ionic strength buffers to the higher ionic strength of seawater (0.72 mol kg–1) makes apparent pH readings drift for a period of time. Furthermore, different electrode designs can result in differing pH readings (Dickson, 1984). This problem can be largely eliminated by calibrating the pH cell against standard buffer solutions such as 2-amino-2-methyl-1,3-propanediol (Tris) in synthetic seawater (DelValls and Dickson, 1998; Nemzer and Dickson 2005). When these procedures are followed carefully, the uncertainty of a potentiometric measurement of seawater pH (expressed total hydrogen ion conentration) can be less than 0.02. The problem is that this approach was not implemented routinely until the 1990s (Dickson, 1993a,b; Dickson et al., 2007).
Whether measured on a ship or back in a shore-based laboratory, pH results have to be corrected back to the in situ temperature at which the samples were originally collected to provide an estimate of the in situ pH. If the difference between the temperature of measurement (usually around room temperature) and the in situ temperature is more than 7 degrees Centigrade, these corrections can be quite large (>0.1 pH units). Unfortunately, much of the supporting metadata (records of the measurement temperature, the in situ temperature and the mathematical formula for conversion of the data from one temperature to the other) was not given to NCEI along with the data files (Boyer et al., 2013). Hence, in many cases, we are not certain what pH value is being reported (measured versus in situ). We suspect that a significant fraction of the historical pH values were reported at laboratory temperature and were never corrected back to the in situ temperature. In many cases, the measurement temperature was not reported as part of the metadata package, making later temperature correction impossible (Boyer et al., 2013). The lack of information as to whether the pH values were reported as measured versus in situ, and the lack of documentation on measurement temperature will lead to large pH uncertainties in the earlier database.
Improvements on the pH measurement technique and data reporting in the post-1990 era
In response to many of these concerns, the international ocean carbon community began a systematic process in the early 1990s to develop rigorous and well-documented procedures for analyzing and reporting pH and carbon system parameter data. Through the major global ocean observational programs in the 1990s like World Ocean Circulation Experiment and the Joint Global Ocean Flux Study, Dr. Andrew Dickson of Scripps Institution of Oceanography was supported to make and distribute Reference Materials (RMs) that could be used by the international carbon community to check the quality of their measurements. With support from SCOR, International JGOFS, WOCE, IOCCP, DOE, NOAA and NSF through the U.S Repeat Hydrography, PICES, EPOCA, and other groups, the community established guidelines for standardized methods for analyzing samples and reporting data (Dickson, 1991; Dickson et al., 2003; Dickson, et al., 2007; Dickson, 2010). We formed international data analysis teams like Surface Ocean Carbon ATlas, Carina, and Pacifica that carefully checked the data to identify mistakes and systematic biases. The carbon data that were evaluated and synthesized were maintained as a database separate from the original data set so that if errors were identified at a later date we could revise the synthesized data set without affecting the original data.
This period was characterized by the establishment of global ocean carbon hydrographic surveys and long-term time series stations that yielded high-quality measurements at highly-resolved temporal and spatial scales. As the greatly improved spectrophotometric pH methods were refined in the early 1990s, there was renewed interest in making high-quality pH measurements. The scientific community had greater trust in these measurements because the measurements could be compared to and validated against the independent measurements of total carbon, pCO2 and total alkalinity from these large community evaluated data sets compiled as previously described. Finally, starting with the WOCE-JGOFS era, we were able to collect high-quality data using standard protocols and validated with reference materials with enough temporal and spatial resolution that would allow us to determine scientifically defensible mean annual oceanic surface water trends. The resulting data from 1989 to the present have been published in many peer-reviewed scientific articles and assessments, culminating in the recent assessment published in the recent IPCC AR5 Working Group 1 Report Chapter 3 (see Rhein et al., 2013).
*The above essay is presented here to provide information about the availability and quality of the historical pH data in the NCEI archives. It was motivated, in part, by e-mail requests for observational pH data by Michael G. Wallace and others over the years.
References
Bates, N.R., Y.M. Astor, M.J. Church, K. Currie, J.E. Dore, M. González-Dávila, L. Lorenzoni, F. Muller-Karger, J. Olafsson, and J.M. Santana-Casiano. 2014. A time-series view of changing ocean chemistry due to ocean uptake of anthropogenic CO2 and ocean acidification. Oceanography 27(1):126–141.
Byrne, R.H. and Breland, J.A., 1989. High precision multiwavelength pH determinations in seawater using cresol red. Deep-Sea Res., 36: 803-810.
Boyer, T.P., J.I. Antonov, O.K. Baranova, C. Coleman, H.E. Garcia, A. Grodsky, D.R. Johnson, R.A. Locarnini, A.V. Mishonov, T.D. O'Brien, C.R. Paver, J.R. Reagan, D. Seidov, I.V. Smolyar, M.M. Zweng, 2013, World Ocean Database 2013. Sydney Levitus, Ed.; Alexey Mishonov, Technical Ed.; NOAA Atlas NESDIS 72, 209 pp.
DelValls, T. A. & Dickson, A. G., 1998. The pH of buffers based on 2-amino-2-hydroxymethyl-1,3-propanediol (‘tris’) in synthetic sea water. Deep-Sea Research I 45, 1541–1554.
Dickson, A. G., 1984. pH scales and proton-transfer reactions in saline media such as sea water. Geochimica et Cosmochimica Acta 48, 2299–2308.
Dickson, A. G., 1991. Measuring Oceanic CO2: Progress on Quality Control. U. S. JGOFS News 3 (2), 4.
Dickson A.G., 1993a. The measurement of seawater pH. Marine Chemistry, 44, 131-142.
Dickson, A. G., 1993b. pH buffers for sea water media based on the total hydrogen ion concentration scale. Deep-Sea Research 40, 107–118.
Dickson, A. G., Afghan, J. D. & Anderson, G. C., 2003. Reference materials for oceanic CO2 analysis: A method for the certification of total alkalinity. Marine Chemistry 80, 185–197.
Dickson, A.G., Sabine, C. L. and Christian,, J. R. (2007). A guide to best practices for ocean CO2 meaurements, PICES Special Publication, 3, 1-191.
Dickson, A.G., 2010. The carbon dioxide system in seawater: equilibrium chemistry and measurements. In Guide to best practices for ocean acidification research and data reporting. Riebesell, U., Fabry, V. J., Hansson, L., & Gattuso, J.-P. (Eds), Chapter 1, pp. 17–40, EUR 24328 EN, European Commission, Brussels, Belgium.
DOE, 1994. Handbook of methods for the analysis of the various parameters of the carbon dioxide system in sea water. version 2, A. G. Dickson & C. Goyet, eds., ORNL/CDIAC-74.
Feely, R.A. (2008): Ocean Acidification. In State of the Climate in 2007, D. H. Levinson and J. H. Lawrimore (eds.). Bull. Am. Meteorol. Soc., 89(7), S58.
Nemzer, B. V. & Dickson, A. G., 2005. The stability and reproducibility of Tris buffers in synthetic seawater. Marine Chemistry 96, 237–242.
Orr, J.C., V.J. Fabry, O. Aumont, L. Bopp, S.C. Doney, R.A. Feely, A. Gnanadesikan, N. Gruber, A. Ishida, F. Joos, R.M. Key, K. Lindsay, E. Maier-Reimer, R. Matear, P. Monfray, A. Mouchet, R.G. Najjar, G.-K. Plattner, K.B. Rodgers, C.L. Sabine, J.L. Sarmiento, R. Schlitzer, R.D. Slater, I. Totterdell, M.-F. Weirig, Y. Yamanaka, and A. Yool (2005): Anthropogenic ocean acidification over the twenty-first century and its impact on calcifying organisms. Nature, 437(7059), doi: 10.1038/nature04095, 681–686.
Rhein, M., S.R. Rintoul, S. Aoki, E. Campos, D. Chambers, R.A. Feely, S. Gulev, G.C. Johnson, S.A. Josey, A. Kostianoy, C. Mauritzen, D. Roemmich, L.D. Talley and F. Wang, 2013: Observations: Ocean. In: Climate Change 2013: The Physical Science Basis. Contribution of Working Group I to the Fifth Assessment Report of the Intergovernmental Panel on Climate Change [Stocker, T.F., D. Qin, G.-K. Plattner, M. Tignor, S.K. Allen, J. Boschung, A. Nauels, Y. Xia, V. Bex and P.M. Midgley (eds.)]. Cambridge University Press, Cambridge, United Kingdom and New York, NY, USA.
Sorensen, S.P.L. and S. Palitzsch, 1910. Uber die Messung der Wasserstoffionenkonzentration des Meerwassers. Biochem. Z., 24: 387.
Zeebe R.E., and D. Wolf-Gladrow 2001. CO2 in Seawater: Equilibrium, Kinetics, Isotopes, Elsevier Oceanography Series, 65, Elsevier, Amsterdam, The Netherlands.


