Chuuk K1
Chuuk Lagoon (7.46°N,151.90°E)
Chuuk Lagoon (Chuuk State, Federated States of Micronesia) is one of the largest semi-closed circular oceanic atoll lagoons in the world, sitting high upon a Pacific Ocean Seamount in Micronesia, Western Pacific (Latitude 7.68°N - 7.38°N, Longitude 151.76°E -151.8°E). It has a circumference of about 225 km-long protective barrier reef roughly triangular in outline with about 61 km east-west and about 53 km north-south between the longest point enclosing a natural harbour. The lagoon is located within the warm pool area with mostly oligotrophic characteristics. The total area of the lagoon is 2131.5 km2 with the total land area of about 99 km2.
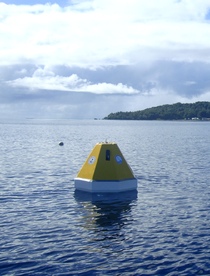
A MAPCO2TM system was deployed within the Chuuk Lagoon in November 2011 at Chuuk K1 station as a part of joint effort between NOAA's PMEL Carbon Group and the Korea Institute of Ocean Science and Technology (KIOST). The goal of this joint effort is to establish a long term monitoring station in Micronesia as part of global ocean monitoring network system for coral reef areas. Local support for the mooring was provided by the Chuuk State Government and the Korea · South Pacific Ocean Research Center (KSORC). KSORC was established on May 30, 2000 to respond to immediate concerns of island nations in the Pacific such as climate change, coastal pollution, and resources development. Deployment and maintenance of the buoy system would not be possible without the help and continuous support from KSORC and Chuuk State.
On November 18, 2011, a surface seawater pH sensor was added to the Chuuk K1 mooring. By measuring pH in addition to pCO2, we are able to more accurately and precisely study the changes associated with ocean acidification. All seawater pH observations are shown in the second figure below.
Finalized Data availability: National Centers for Environmental information NCEI.
Plots of surface water and atmospheric CO2 and surface water pH (click+drag to zoom):
Monthly climatology of surface seawater aragonite saturation state (Ω) and pH:
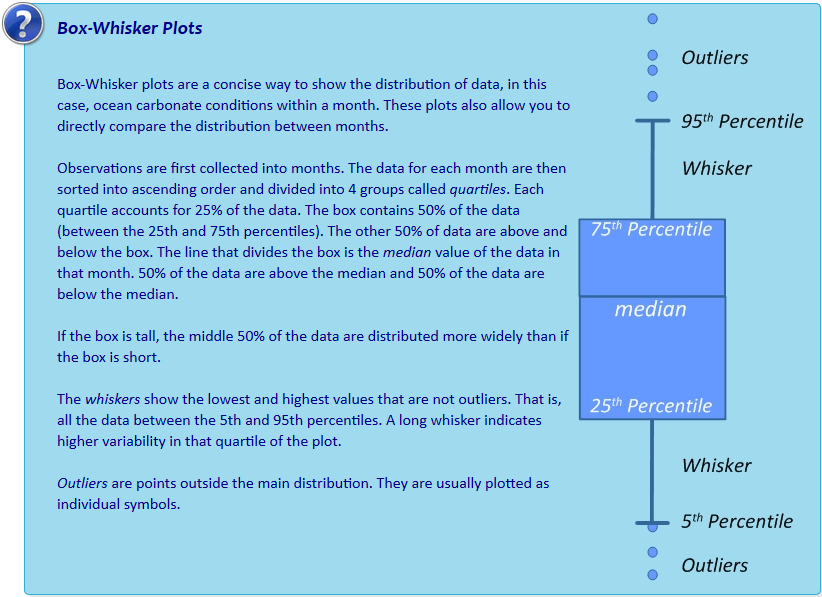
Interactive box plots below are observations binned by month as described in Sutton et al., 2016. Pie charts represent % of observations within each month that fall below the adjustable line. This adjustable line is meant to provide a tool for assessing potential biological thresholds. For example, setting the line to Ωaragonite of ~2.0 would assess monthly exposure of Pacific oyster larvae to sub-lethal chronic effects in regions where these larvae occur naturally or in hatcheries (see studies here and here).

