BOBOA
Bay of Bengal Ocean Acidification (BOBOA) Mooring (15°N, 90°E)
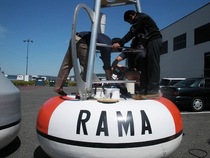
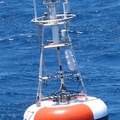
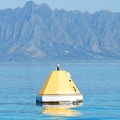
The Bay of Bengal Ocean Acidification (BOBOA) moored buoy was deployed at 15°N, 90°E on 23 November 2013 from the Indian Research Vessel Sagar Nidhi. This is the first CO2 flux and ocean acidification mooring in the northern Indian Ocean. Data from the buoy will help us understand the large intraseasonal, seasonal and interannual biogeochemical variations in the Bay of Bengal, and track how the marine ecosystem in the Bay is changing over time. Establishment of this time series was only possible through a close partnership between the Bay of Bengal Large Marine Ecosystem Project (BOBLME), with funding support from the Norwegian Agency for Development Cooperation, NOAA’s Ocean Acidification Program, the Research Moored Array for African-Asian-Australian Monsoon Analysis and Prediction (RAMA), NOAA’s Pacific Marine Environmental Laboratory, the Indian National Centre for Ocean Information Services, and the National Institute of Ocean Technology.
The Bay of Bengal is a region of strong ocean-atmosphere interactions. Air-sea flux of heat and CO2 is heavily influenced by severe tropical storms and by large intraseasonal, seasonal and interannual variations in surface heat and fresh water fluxes. In addition to the suite of meteorological sensors measuring winds, air temperature, rainfall, etc. and subsurface sensors measuring ocean temperature, salinity, and velocity this RAMA buoy is now measuring pCO2, pH, and other biogeochemical parameters at the ocean surface and marine boundary layer air xCO2.
BOBOA is part of the RAMA array and the global network of OceanSITES time series flux reference sites. This project brings together scientists from the U.S. and the BOBLME countries (India, Bangladesh, Indonesia, Malaysia, Maldives, Myanmar, Sri Lanka, and Thailand) to collaborate on long term, sustained ocean observations to better understand the role of the Indian Ocean in the global carbon cycle and how it is changing over time.
Finalized Data: National Centers for Environmental Information NCEI.

